
Netdata
Netdata dashboards for Grafana via Prometheus. Forked from this dashboard with a lot of fixes (renamed old metrics, fixed filters): https://grafana.com/grafana/dashboards/7107
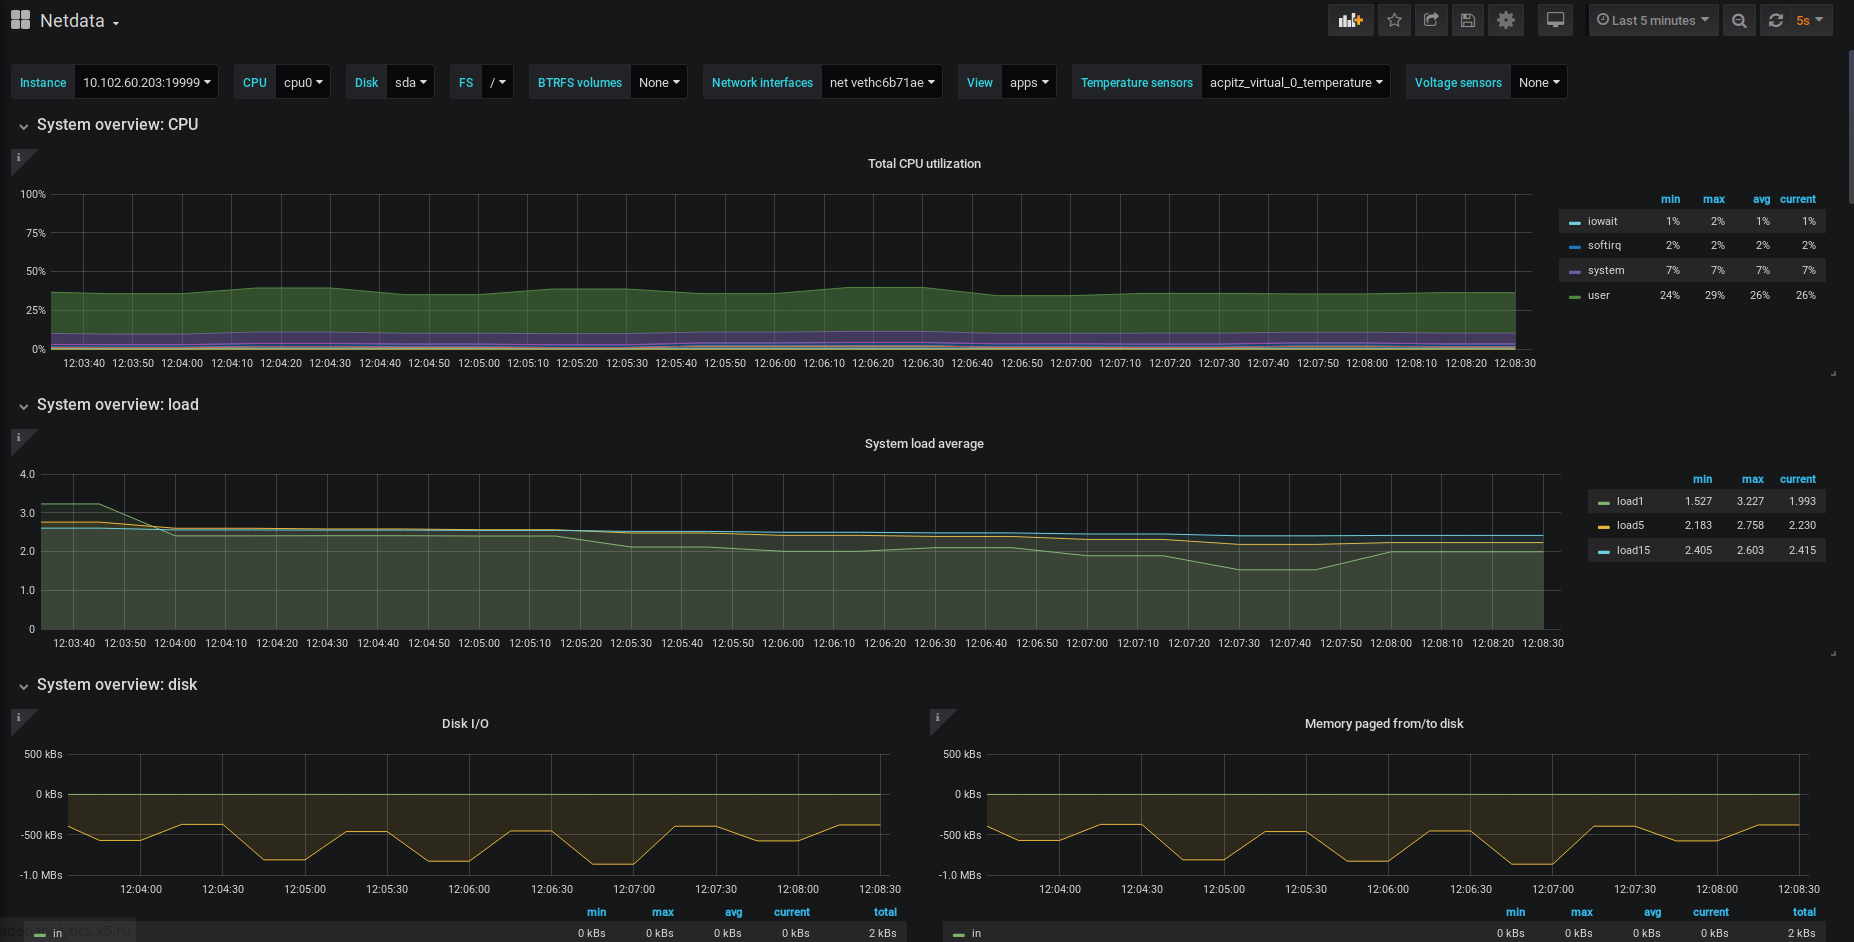
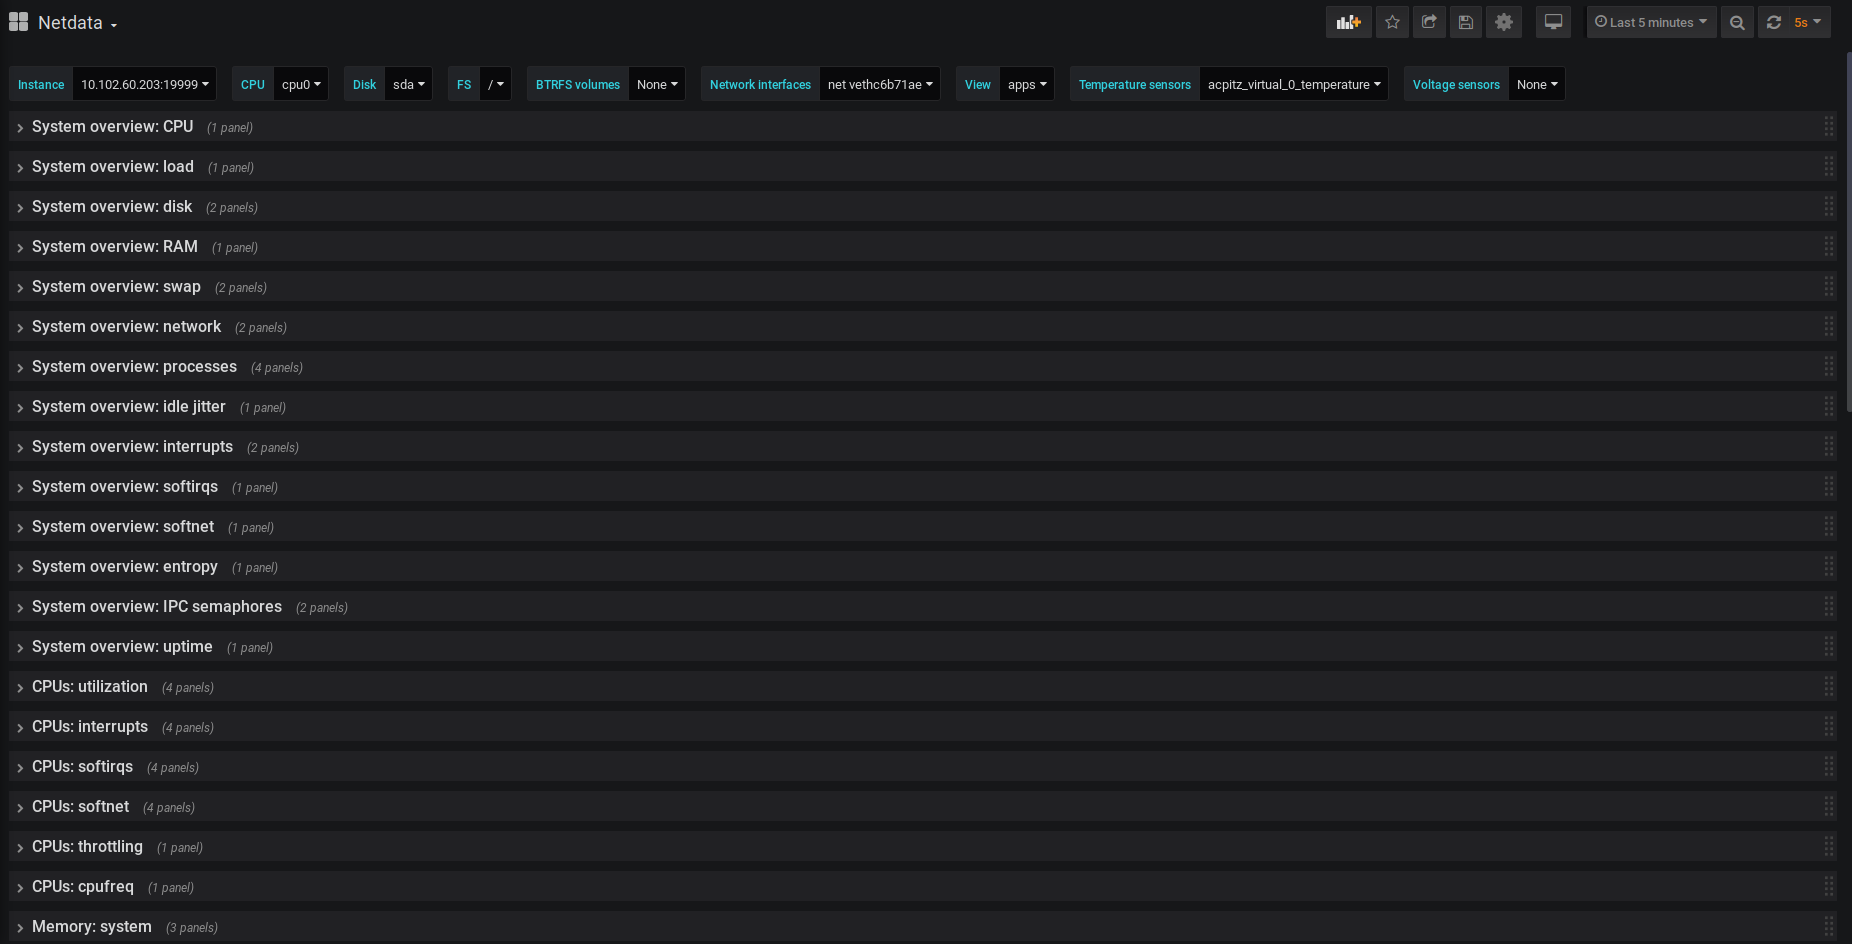
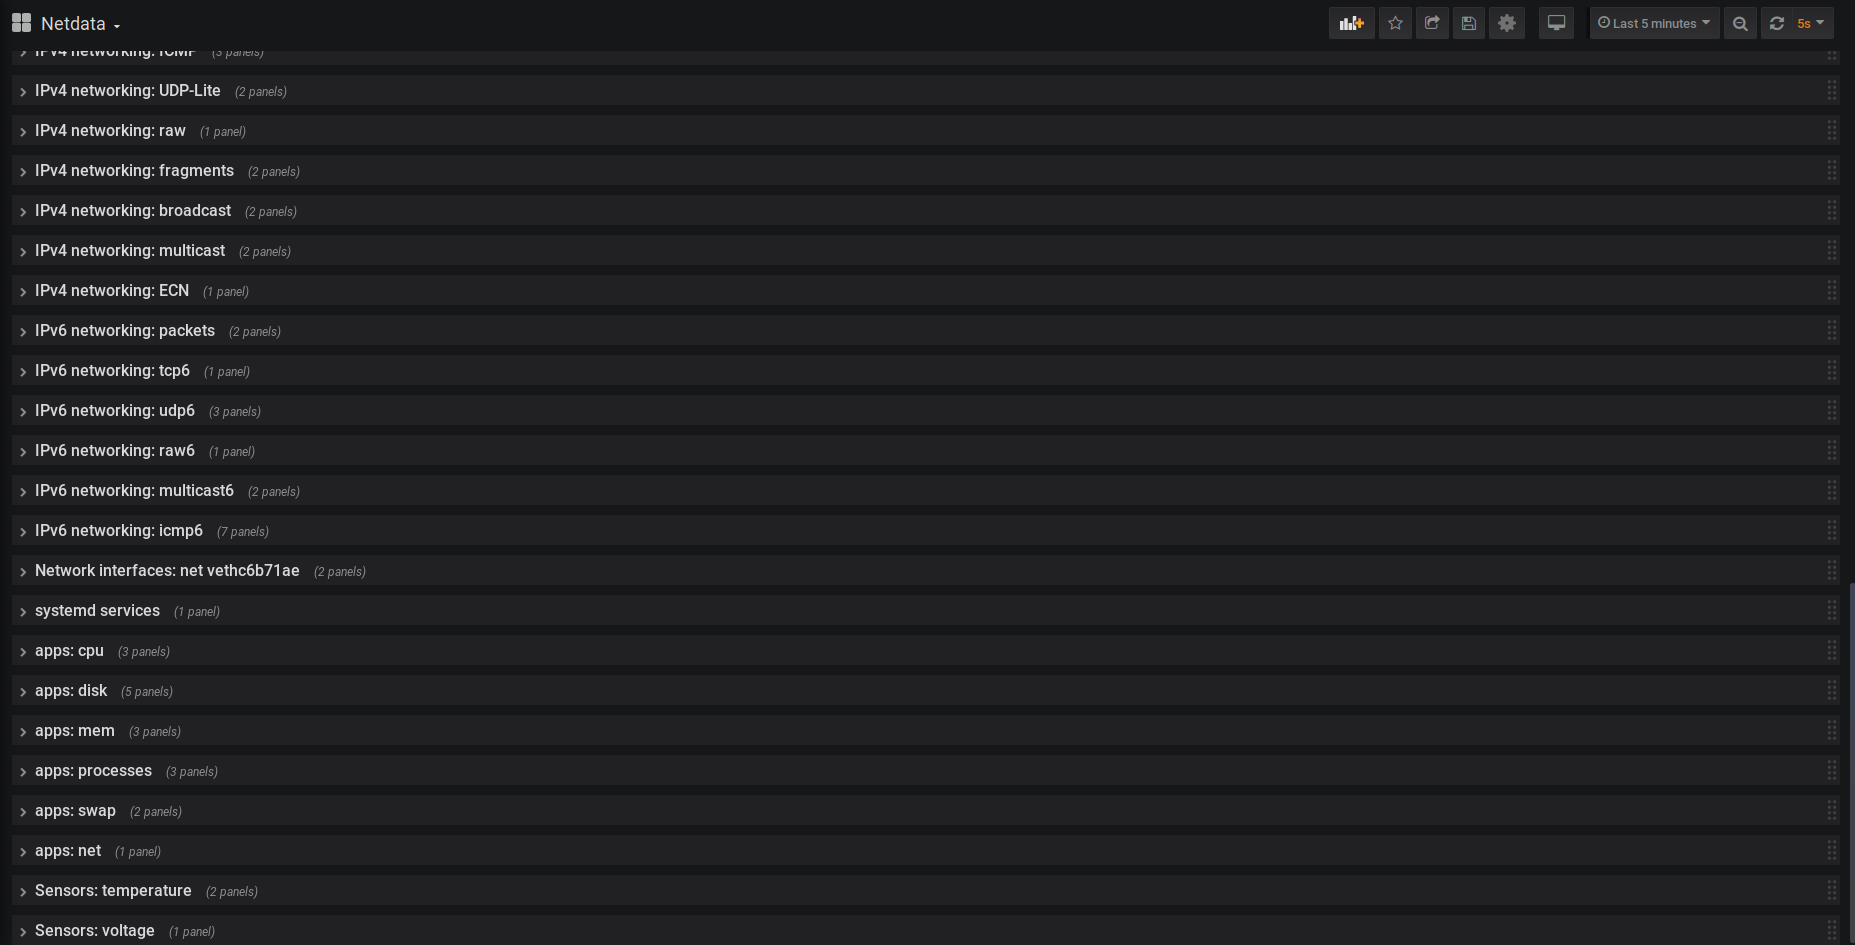
Everything other than the firewall graphs and the Netdata-specific graphs are there.
Some graphs are better made than others based on the available data at the time they were made. The dashboard will be refined over time as it gets used.
Forked from this dashboard with a lot of fixes (renamed old metrics, fixed filters): https://grafana.com/grafana/dashboards/7107
Data source config
Collector type:
Collector plugins:
Collector config:
Revisions
Upload an updated version of an exported dashboard.json file from Grafana
| Revision | Description | Created | |
|---|---|---|---|
| Download |