K8S - ETCD Cluster Health
Etcd Dashboard for Prometheus metrics scraper
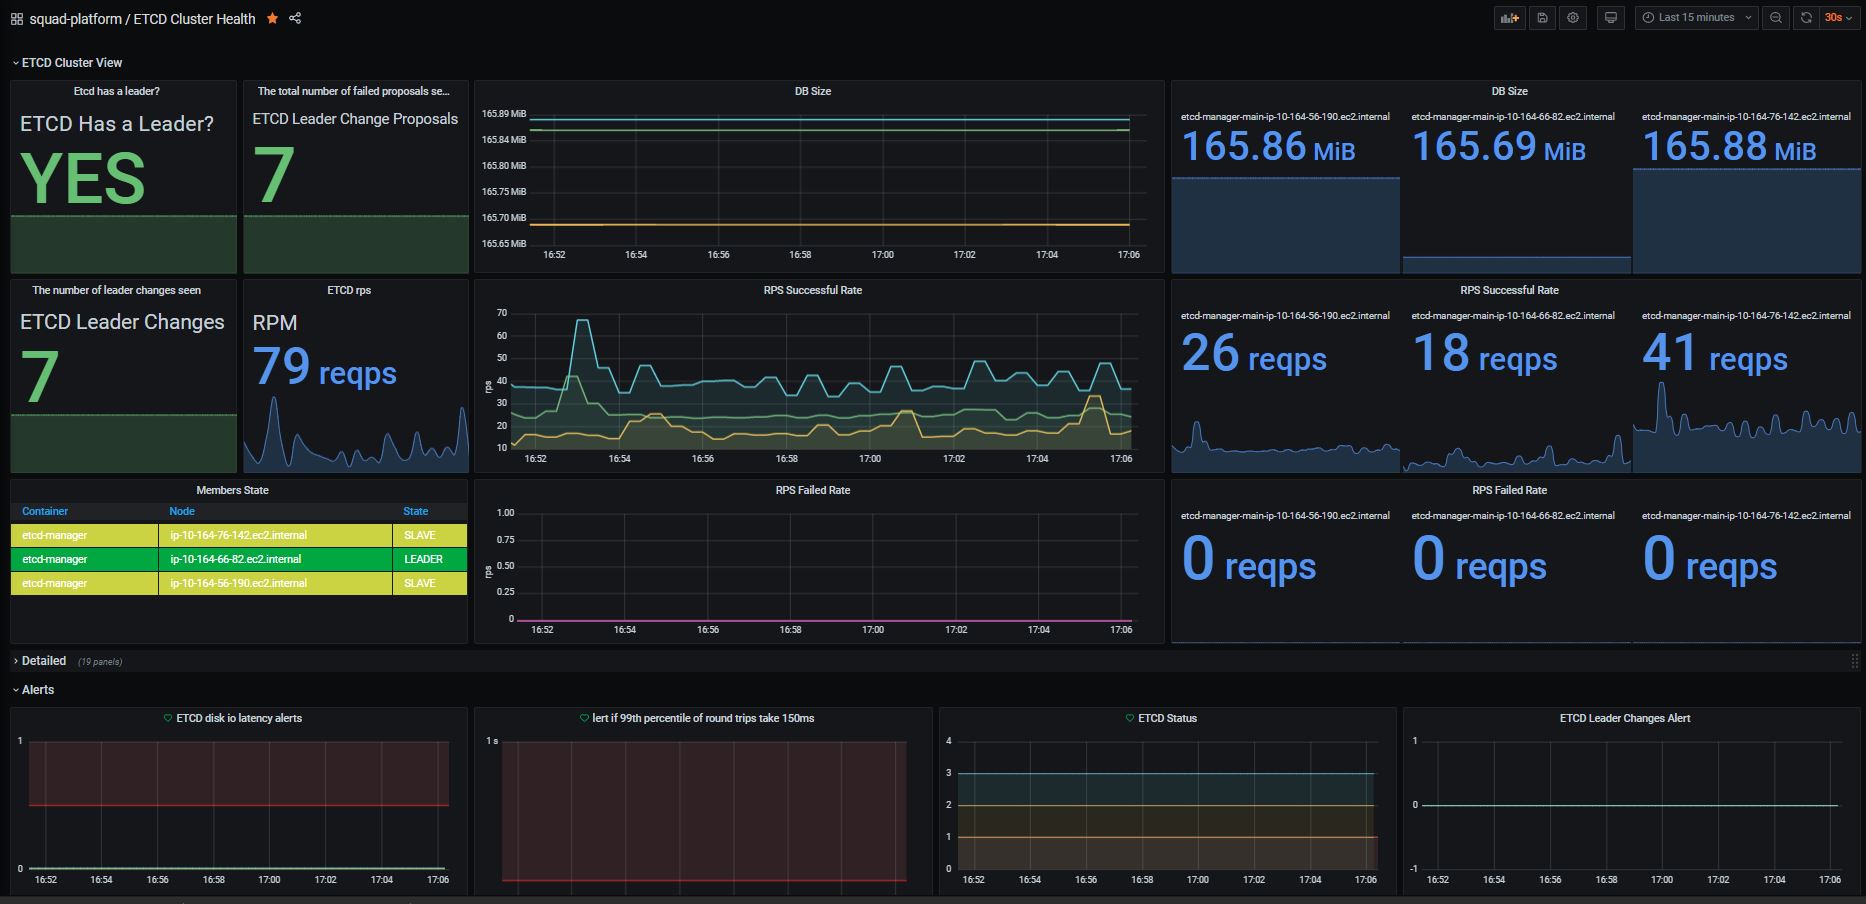
This dashboards will show you all information needed to monitor your ETCD Cluster.
- Cluster Status
- Leader Changes
- Resources Utilization
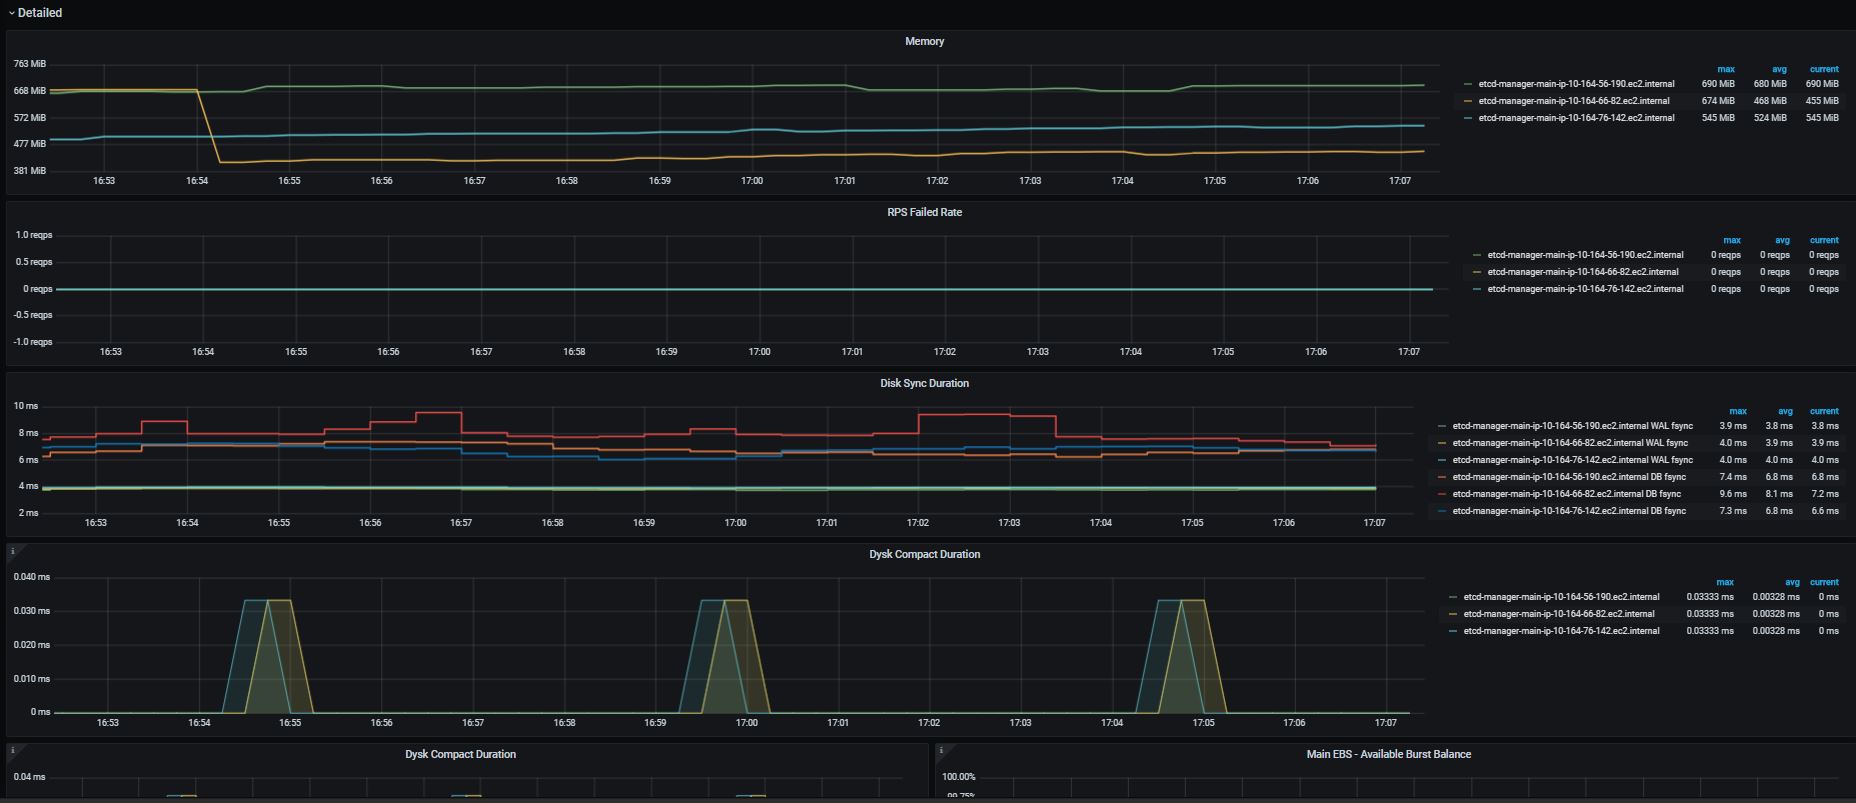
- Detailed informations
- A row of alarms
To use it, you must have:
- Metrics Server Exporter
- Kube State Metrics
- ETCD v3.0.0+
- Kubernetes 1.14.0+
Prometheus ETCD Scrap Config:
    - job_name: 'etcd-manager'
      kubernetes_sd_configs:
      - role: pod
      tls_config:
        ca_file: /etc/prometheus/etcd-certs/etcd-clients-ca.crt
        cert_file: /etc/prometheus/etcd-certs/prometheus-etcd.crt
        key_file: /etc/prometheus/etcd-certs/prometheus-etcd.key
        insecure_skip_verify: true
      scheme: https
      metrics_path: '/metrics'
      relabel_configs:
        - action: keep
          regex: ^(etcd-manager-main-.*)$
          source_labels:
          - __meta_kubernetes_pod_name
        - source_labels: [__address__]
          action: replace
          regex: (.+)
          replacement: $1:4001
          target_label: __address__
        - source_labels: [__meta_kubernetes_pod_node_name]
          action: replace
          target_label: node_name
        - source_labels: [__meta_kubernetes_pod_name]
          action: replace
          target_label: pod_name
        - source_labels: [__meta_kubernetes_pod_container_name]
          action: replace
          target_label: container_name
        - action: labelmap
          regex: __meta_kubernetes_pod_label_(.+)
          replacement: $1
Data source config
Collector type:
Collector plugins:
Collector config:
Revisions
Upload an updated version of an exported dashboard.json file from Grafana
| Revision | Description | Created | |
|---|---|---|---|
| Download |
Kubernetes
Monitor your Kubernetes deployment with prebuilt visualizations that allow you to drill down from a high-level cluster overview to pod-specific details in minutes.
Learn more