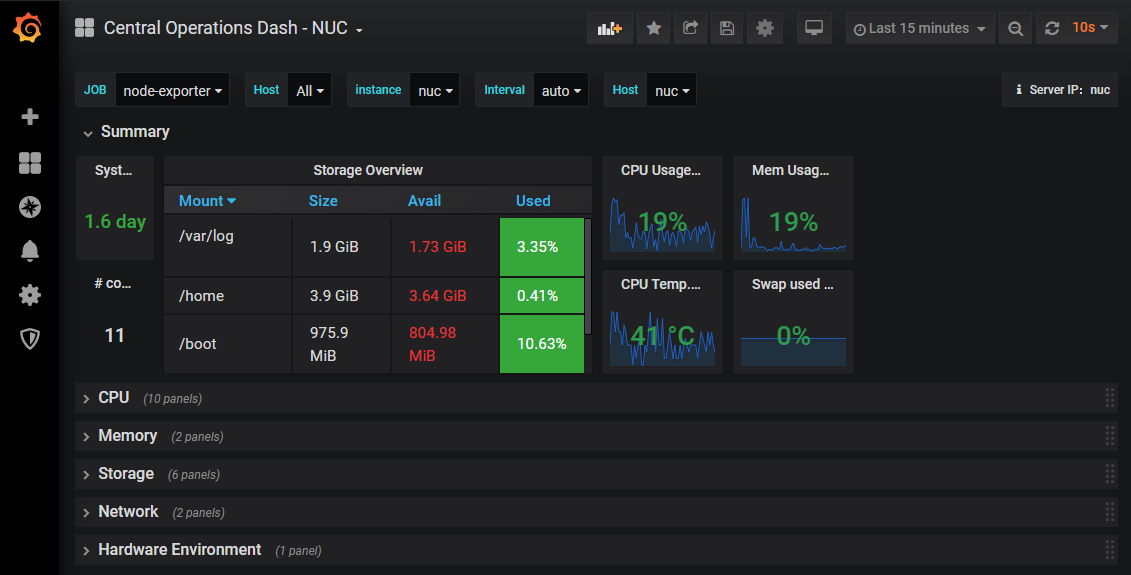
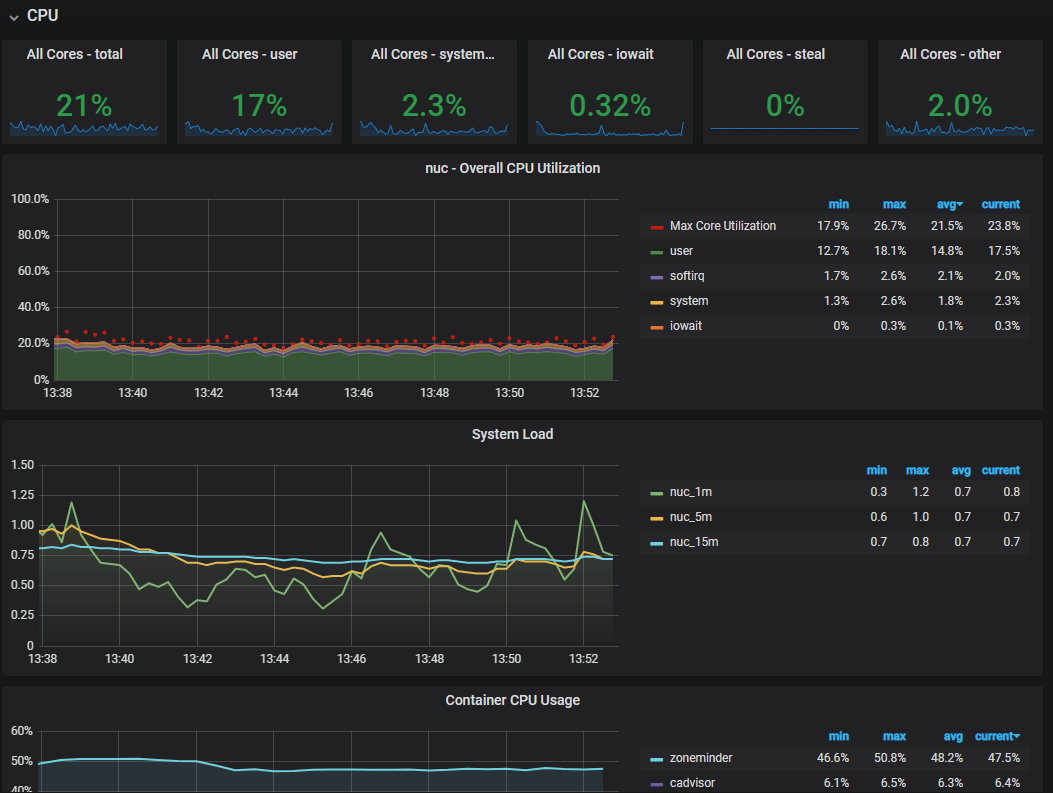
Central Operations Dash - NUC
Inspired by A LOT of others, this is my go-to-dash. Change the $node variable as I use this for Node-exporters 'nuc'. A collection of Node-Exporter, Cadvisor and Prometheus.
Data source config
Collector config:
Upload an updated version of an exported dashboard.json file from Grafana
| Revision | Description | Created | |
|---|---|---|---|
| Download |


