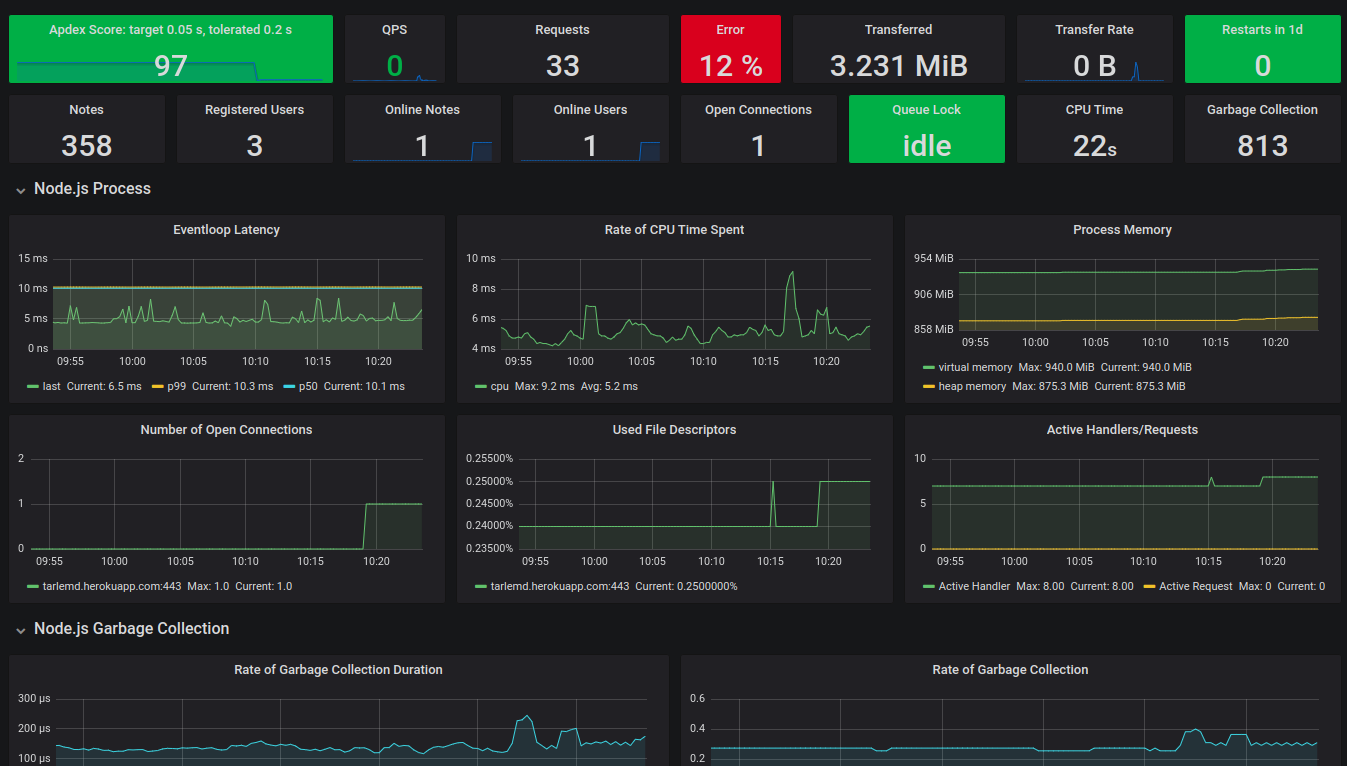
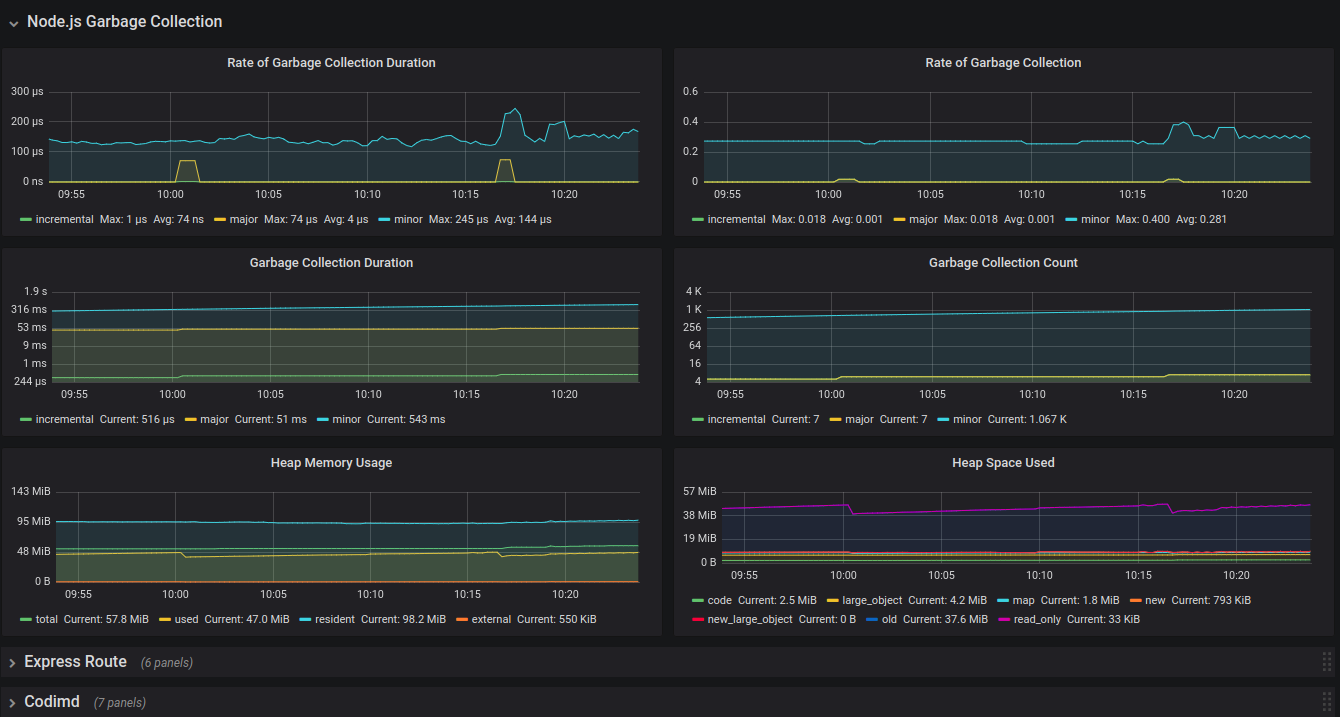
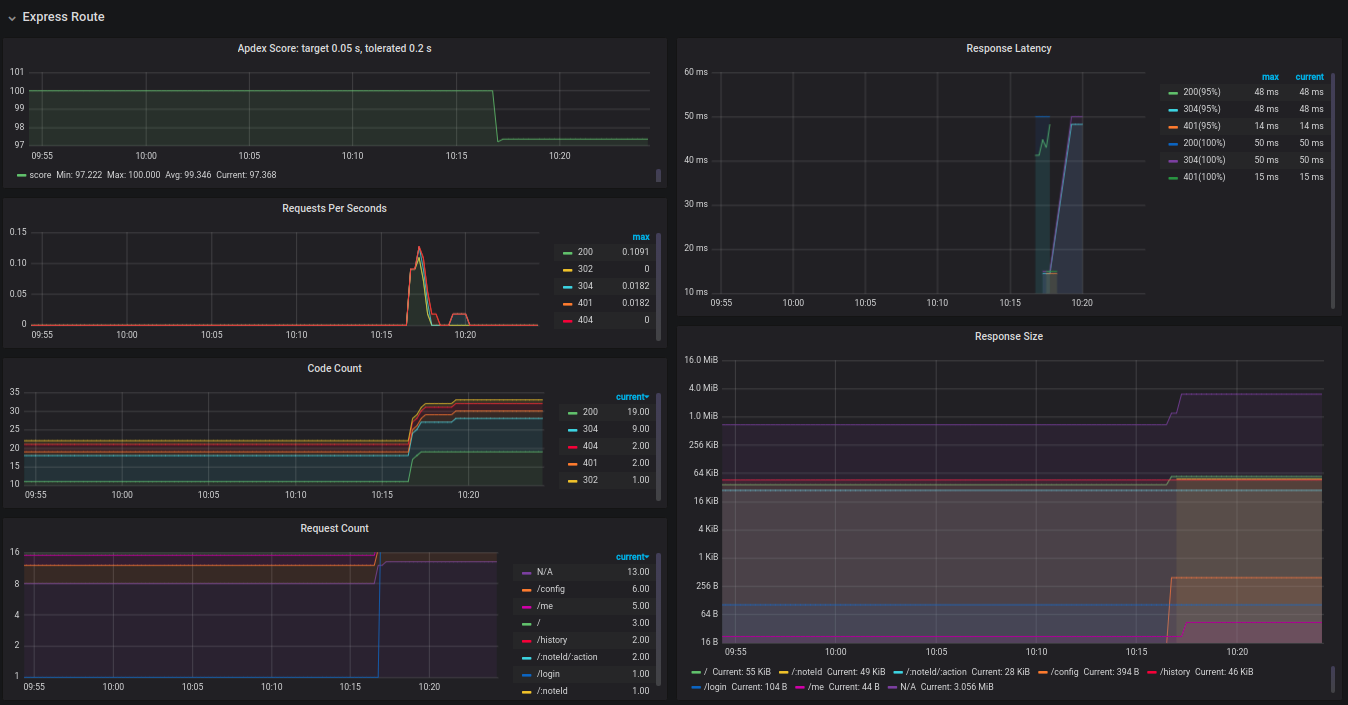
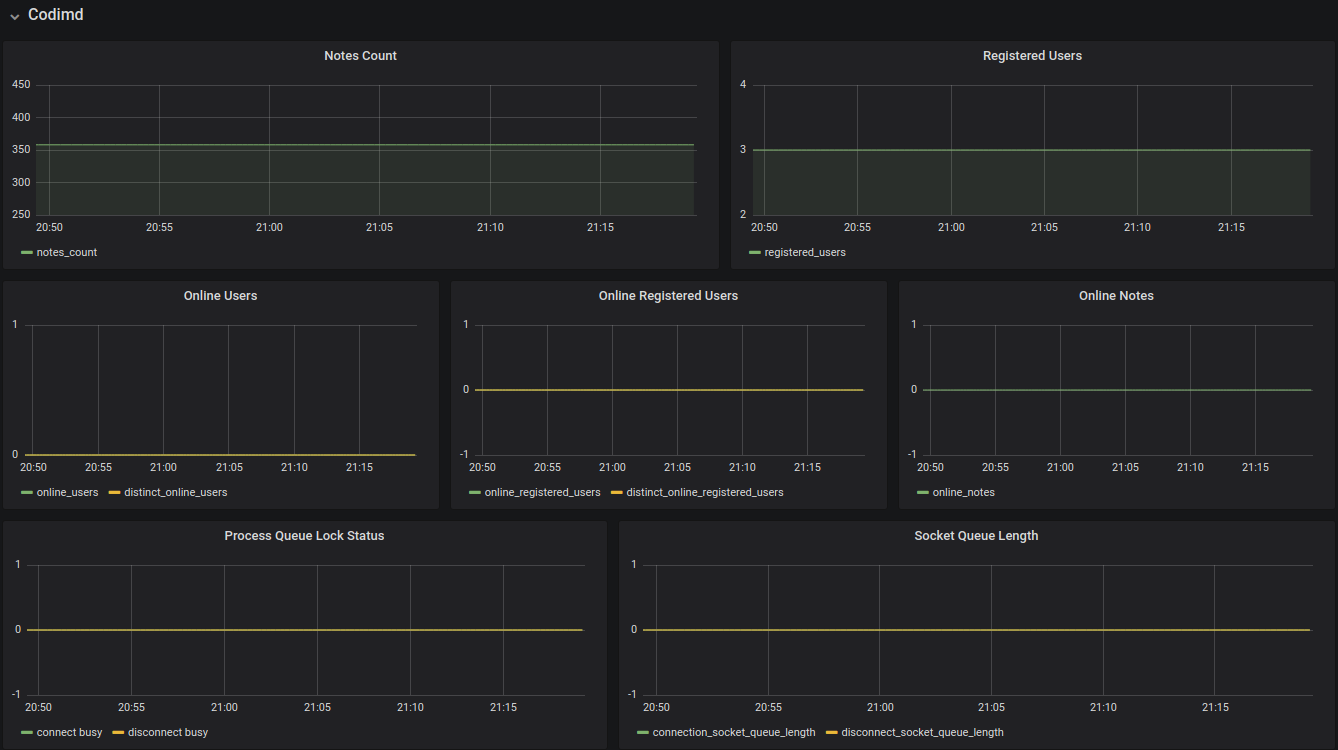
Codimd Dashboard
Monitor metrics for node.js, express, router, and codimd realtime status.
Introduce
The Codimd Dashboard is introduced on Codimd Issue #1446.
Prometheus Configuration Example
- job_name: codimd-router
  honor_timestamps: true
  scrape_interval: 5s
  scrape_timeout: 5s
  metrics_path: /metrics/router
  scheme: http
  static_configs:
  - targets:
    - localhost:3000
- job_name: codimd
  honor_timestamps: true
  scrape_interval: 5s
  scrape_timeout: 5s
  metrics_path: /metrics/codimd
  scheme: http
  static_configs:
  - targets:
    - localhost:3000
Data source config
Collector config:
Upload an updated version of an exported dashboard.json file from Grafana
| Revision | Description | Created | |
|---|---|---|---|
| Download |


