
Traefik Metrics
Traefik Metrics Dashboard
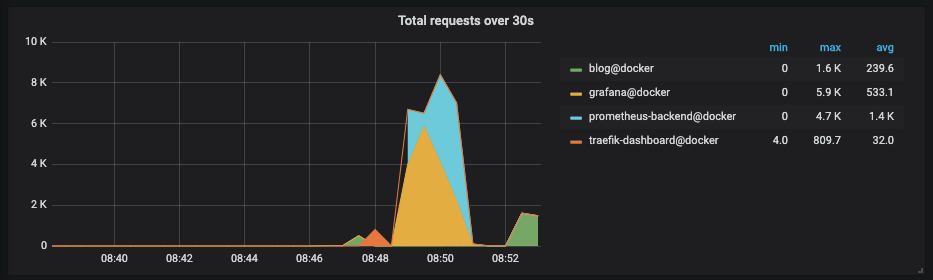
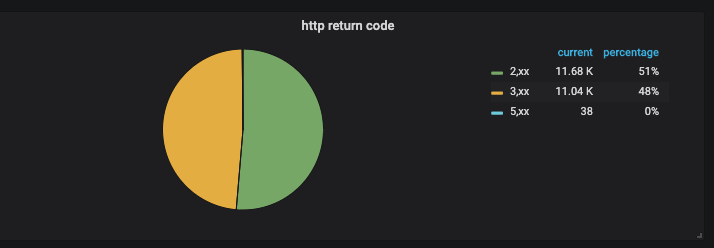
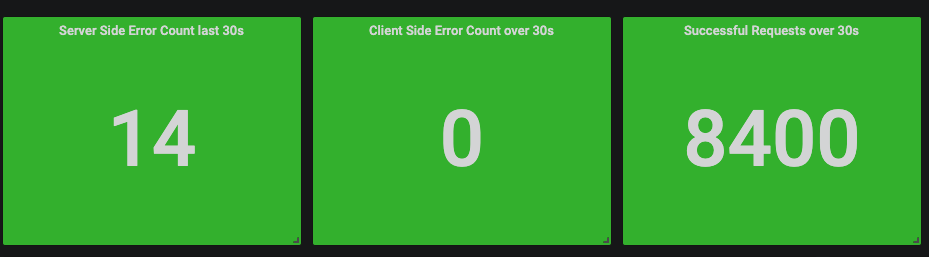
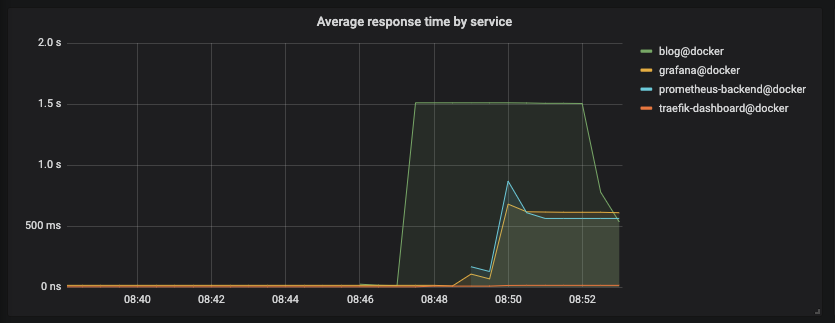
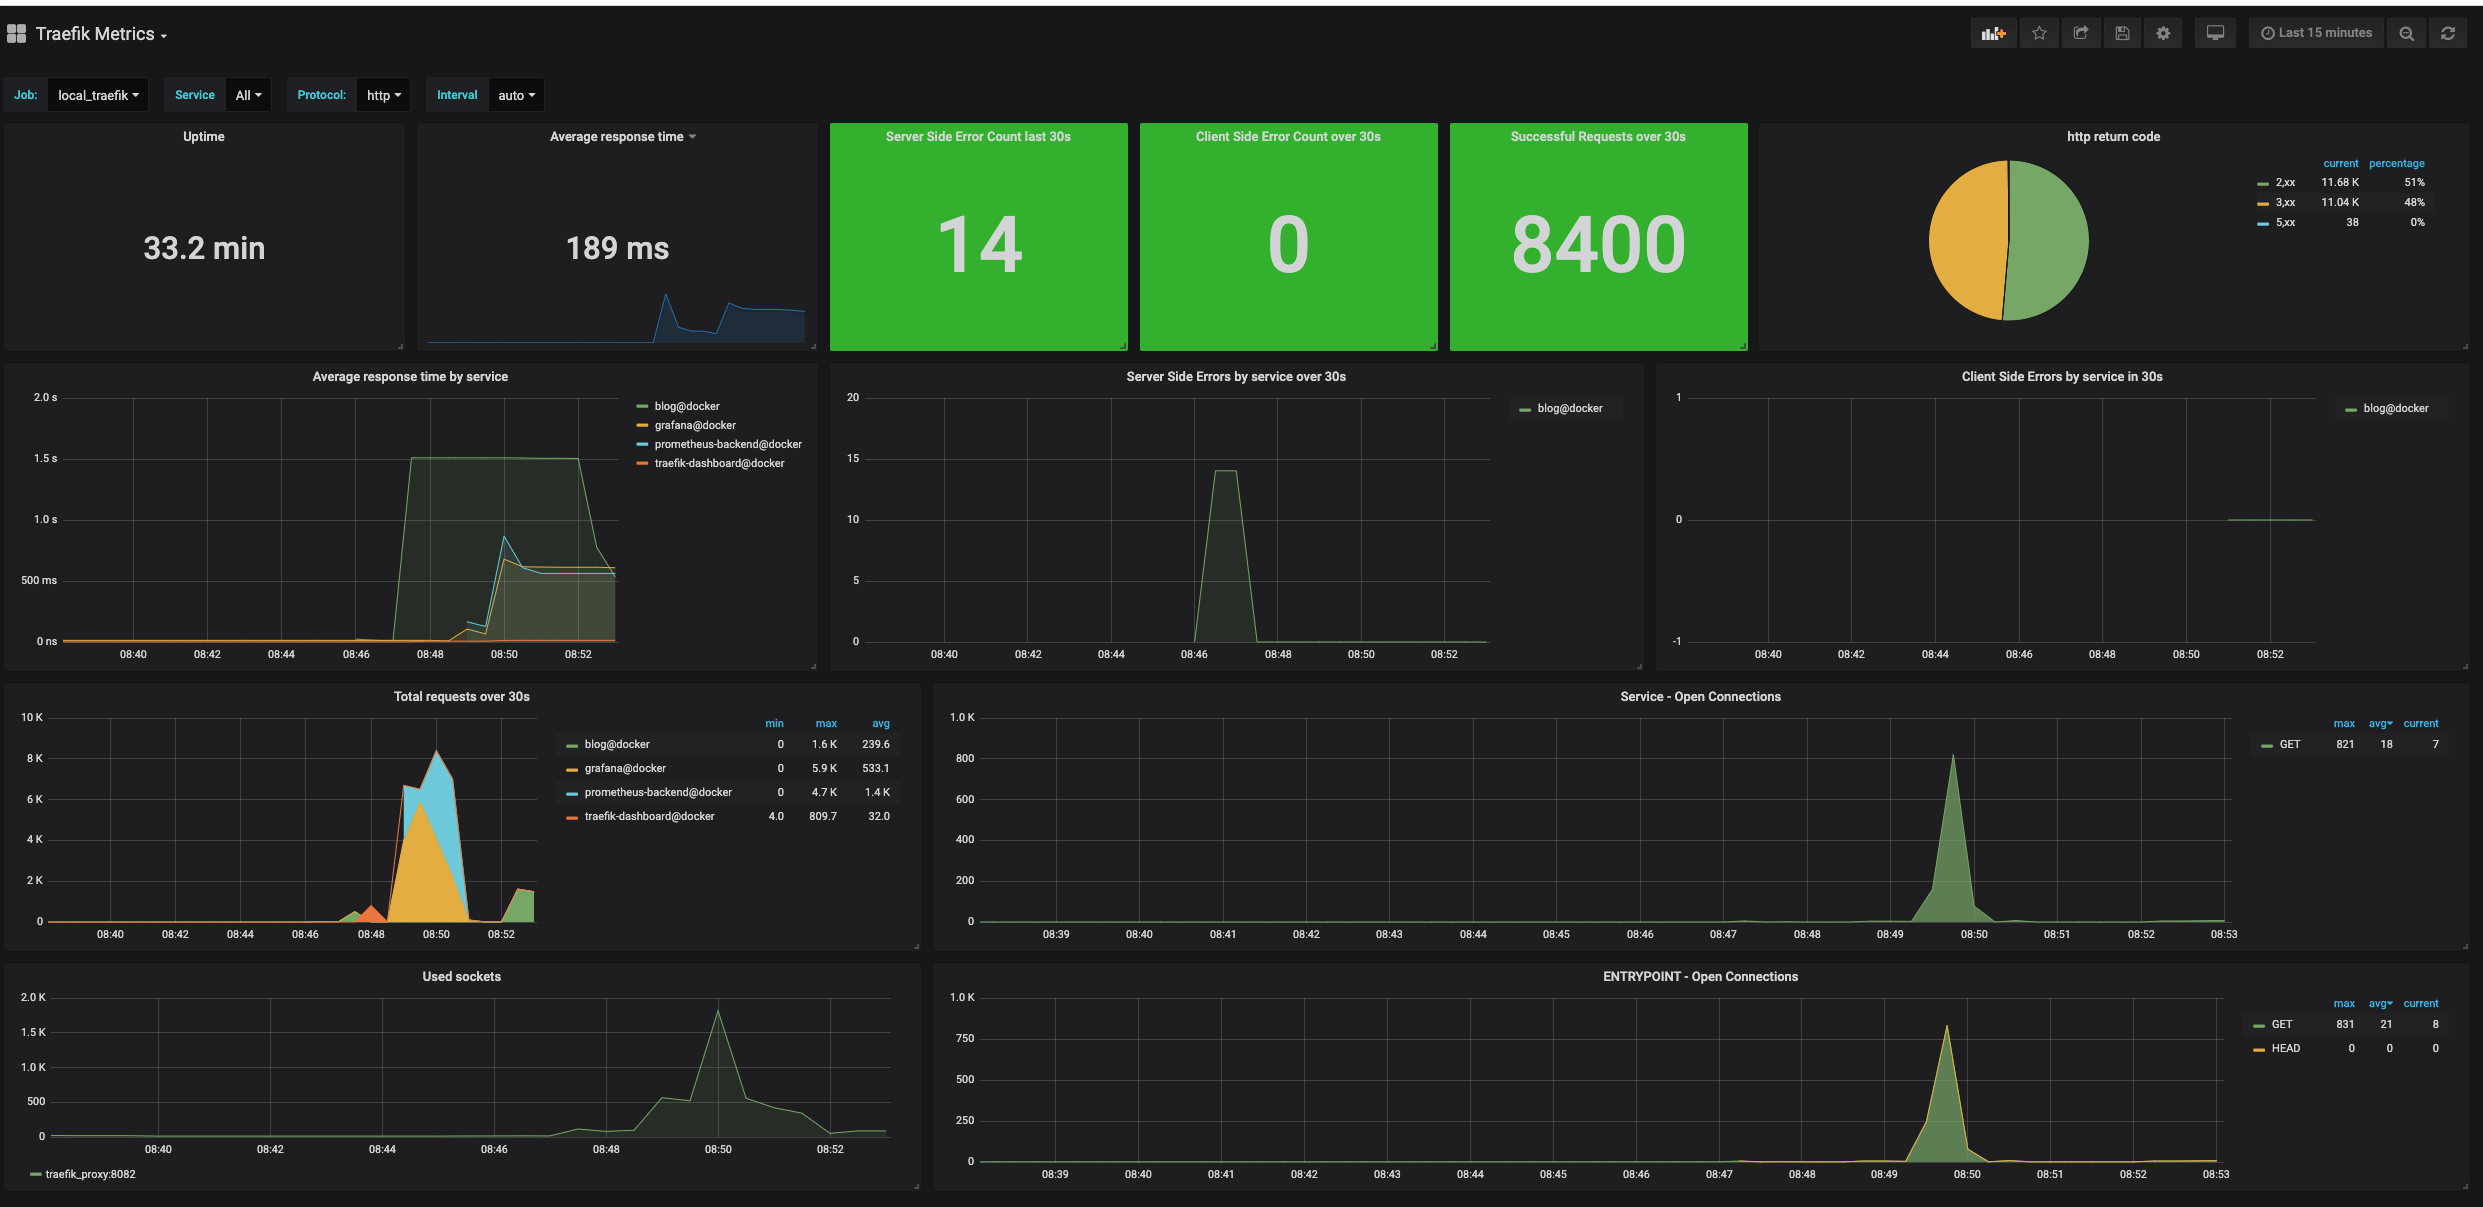
The Traefik Metrics dashboard uses the prometheus data source to create a Grafana dashboard with the grafana-piechart-panel, graph and singlestat panels.
Data source config
Collector type:
Collector plugins:
Collector config:
Revisions
Upload an updated version of an exported dashboard.json file from Grafana
| Revision | Description | Created | |
|---|---|---|---|
| Download |
Traefik
Easily monitor Traefik, the dynamic load balancer, with Grafana Cloud's out-of-the-box monitoring solution.
Learn more