Azure Network Security Group (NSG) Flows
https://github.com/bhozar/grafana-dashboards Azure NSG flow log visualization dashboard.
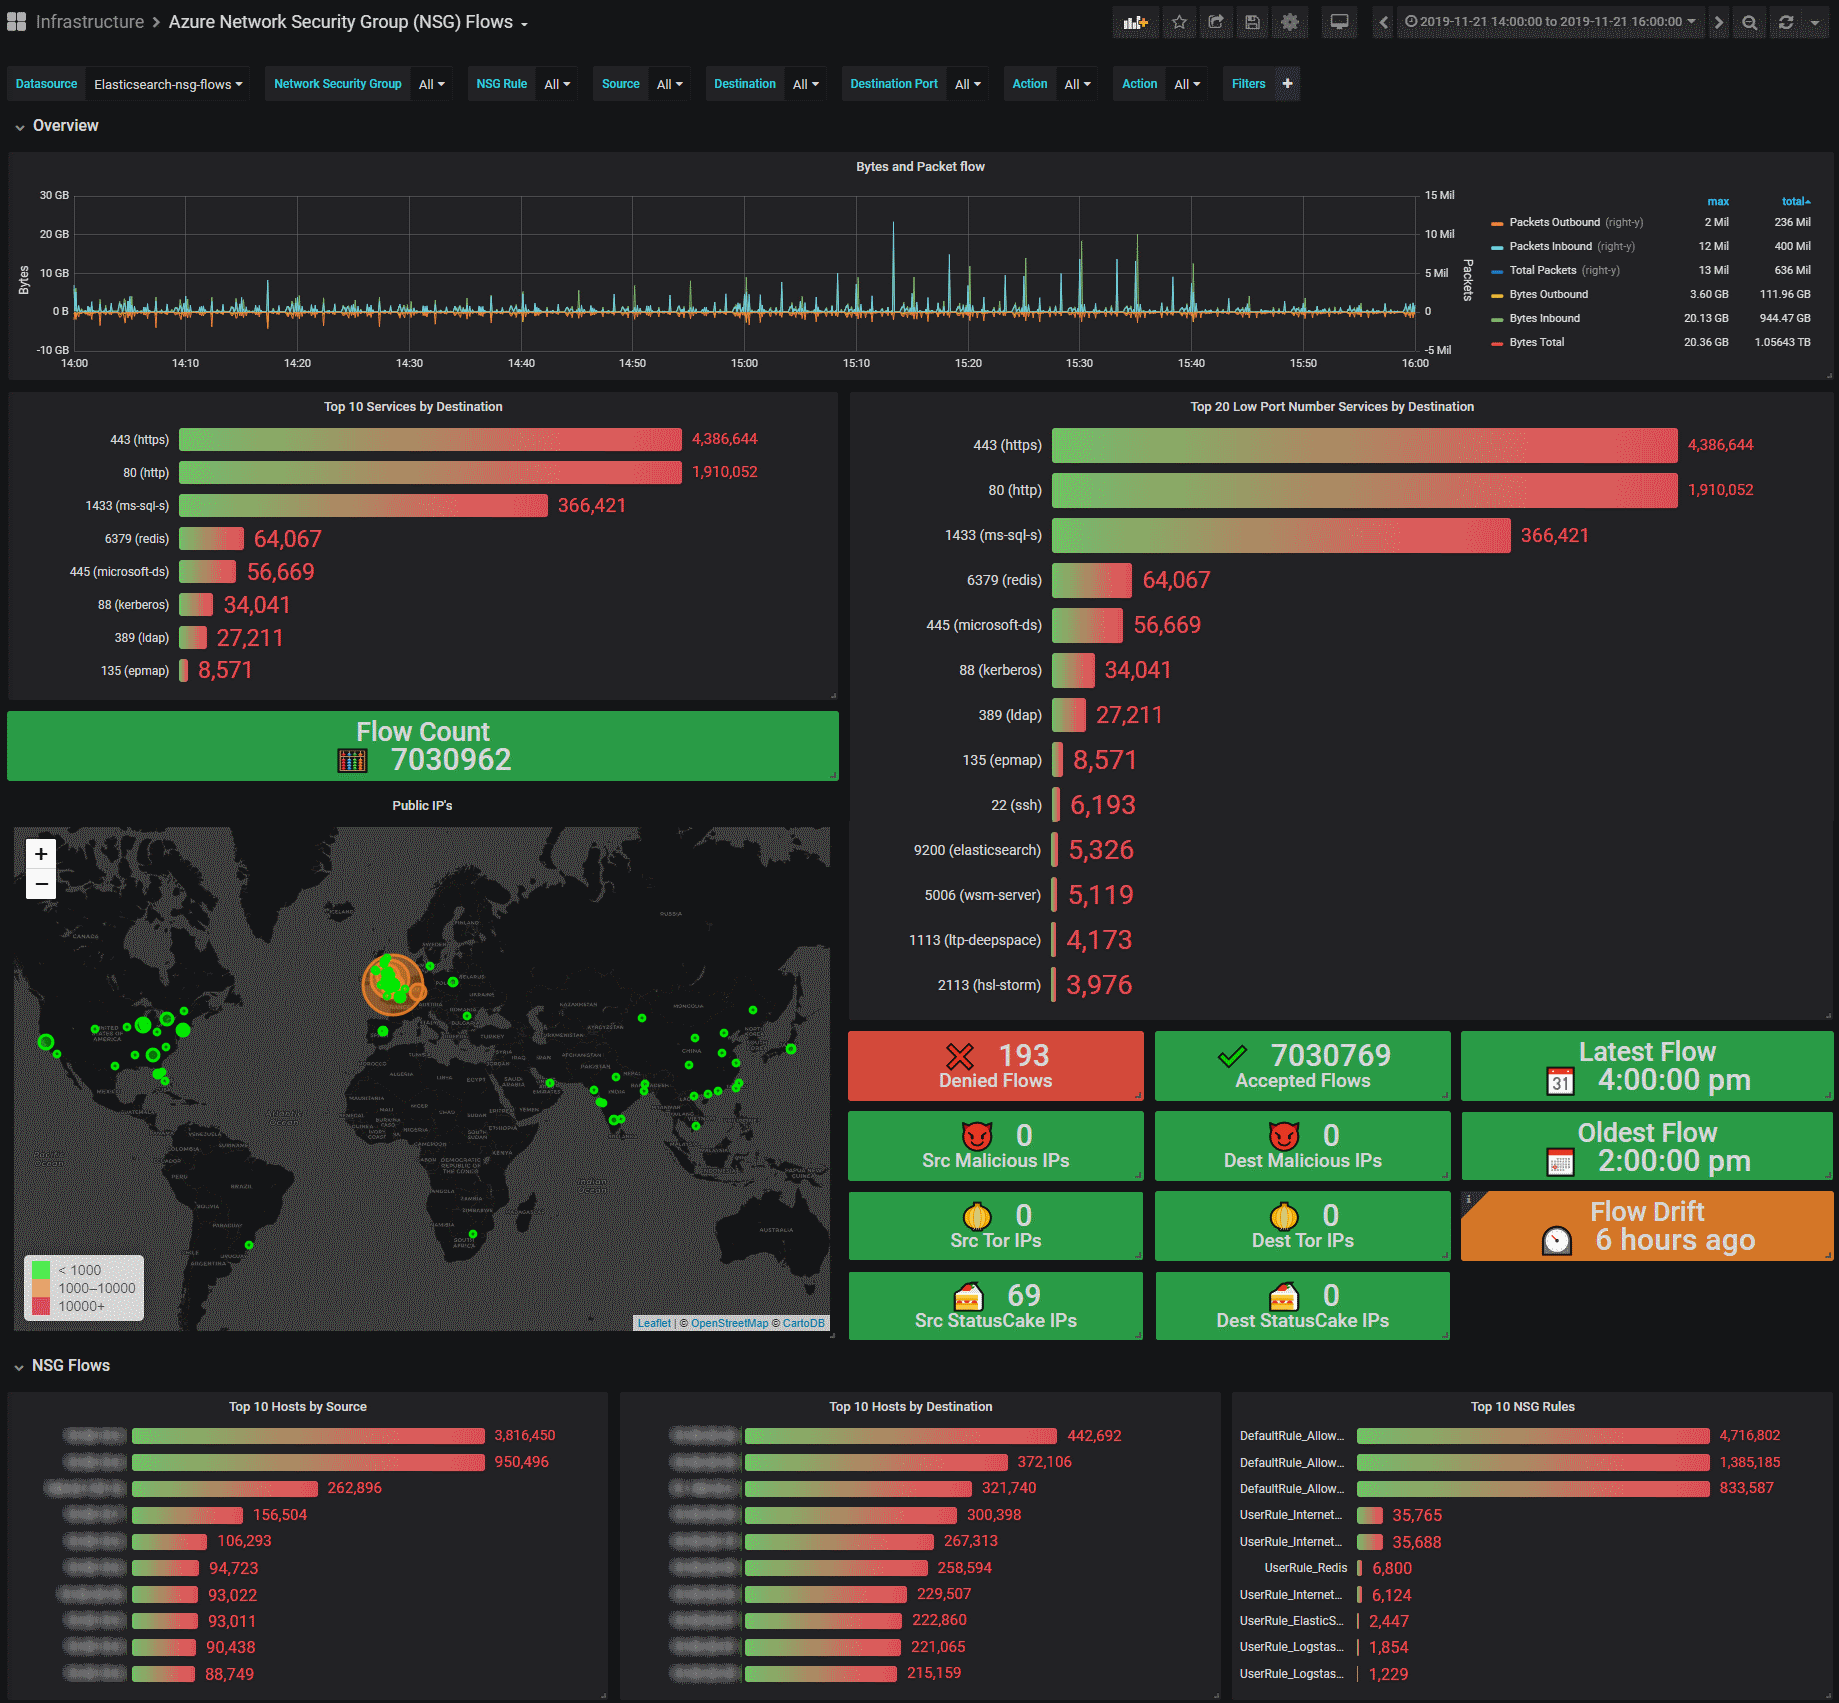
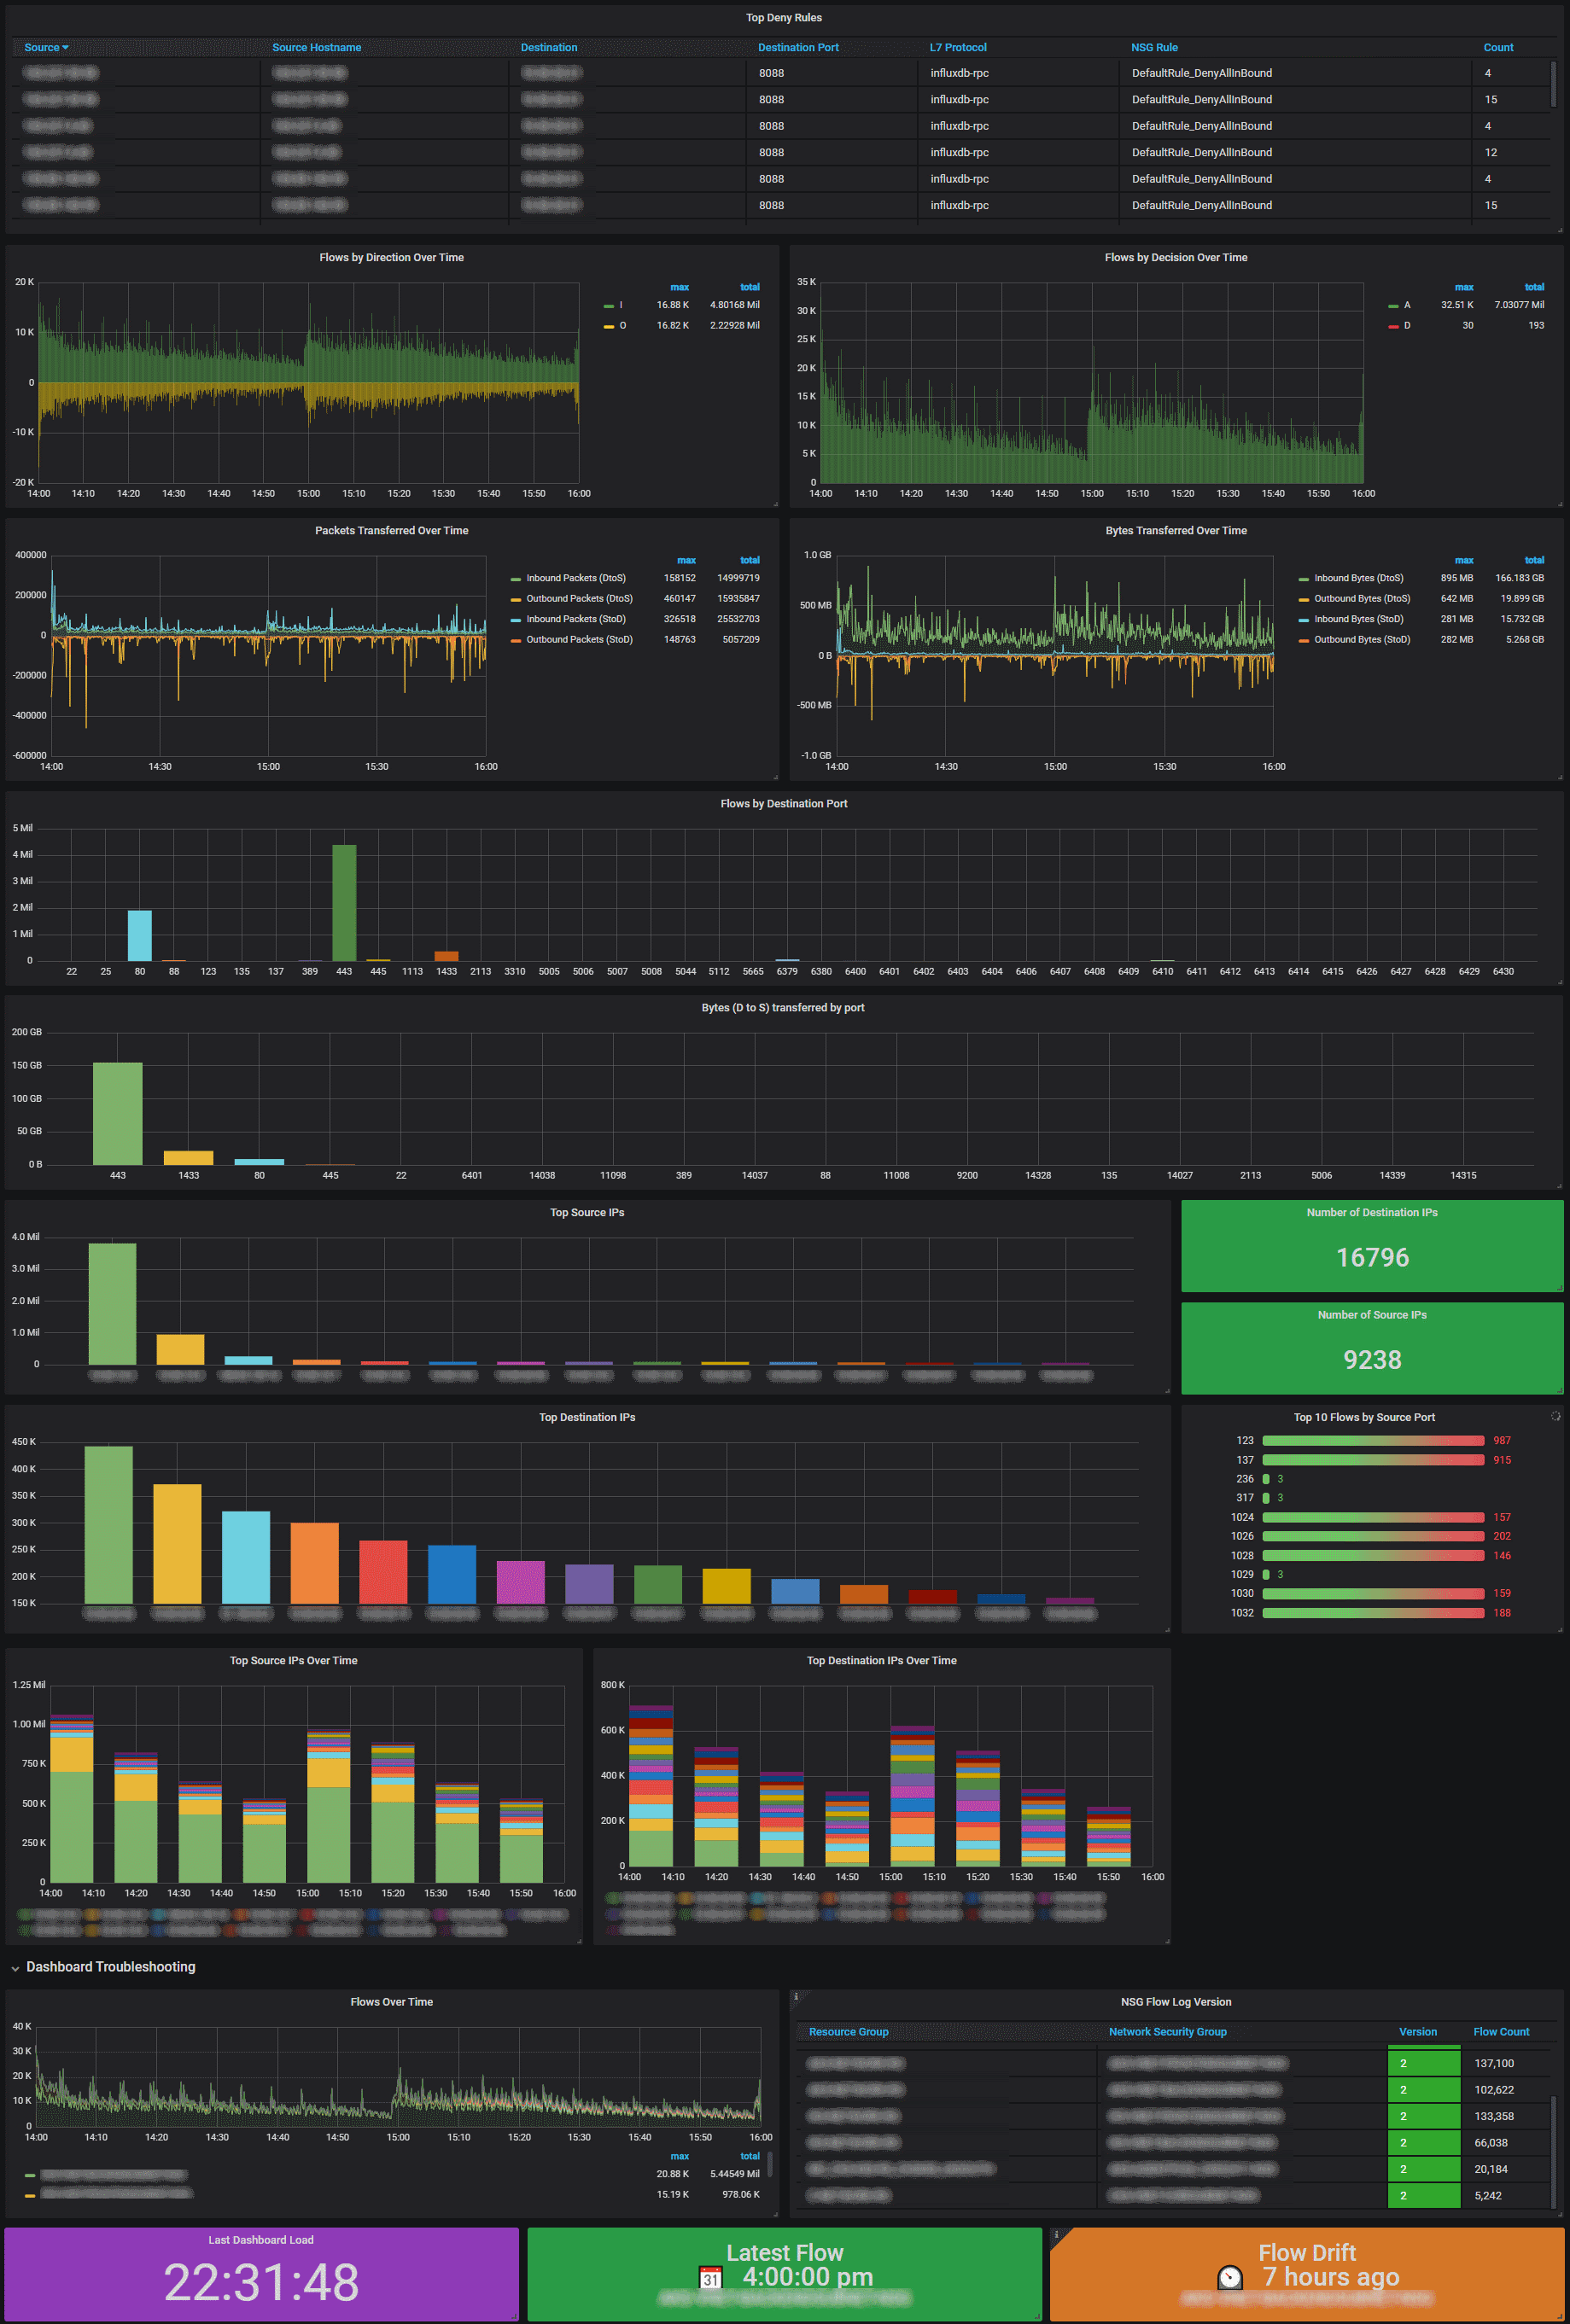
Azure NSG Flow Log Dashboard
Dashboard to visualize Azure NSG Flow Logs data from Logstash Event Hubs plugin
Deploy Microsofts Azure Network Watcher NSG Flow Logs Connector Function App to gather the data. Enabling Application Insights to troubleshoot the Function app is helpful at the start but the cost can quickly add up.
Setup Azure NSG FLow Logs to stream data in an Azure EventHub so the ES plugin can pickup the data.
To control the costs and increase throughput you will want to increase the batch sizes of how often the Logstash Event Hub data source saves the checkpoints to storage, and increase the number of pipeline.workers and pipeline.batch.size options.
Bugs, suggestions and feedback
Bug reports, suggestions and feedback to GitHub please!
Logstash Filters
00-input-azureeventhubs.conf
input {
   azure_event_hubs {
   event_hub_connections => ["Endpoint=sb://xxxxxxx.servicebus.windows.net/;SharedAccessKeyName=logstash-ro;SharedAccessKey=..."]
   threads => 32
   max_batch_size => 1000
#   checkpoint_interval => 30
   initial_position => "end"
   decorate_events => true
   consumer_group => "logstash-nsglogs"
## Storage account required to store starting point between restarts
   storage_connection => "DefaultEndpointsProtocol=https;AccountName=...EndpointSuffix=core.windows.net"
   tags => ["azurensglogs"]
   }
}
01-filter-azure-nsg-logs.conf
filter {
if [@metadata][azure_event_hubs][consumer_group] == "logstash-nsglogs" {
# if "azurensglogs" in [tags] {
 mutate {
   gsub => [ "message", "^{\"records\":\[{", "" ]
   gsub => [ "message", "},{.*}]}$", "" ]
   gsub => [ "message", "[\"]", "" ]
}
 kv {
   field_split_pattern => ","
   value_split => ":"
}
  mutate {
   convert => {"startTime" => "integer"}
   convert => {"sourcePort" => "integer"}
   convert => {"destinationPort" => "integer"}
   convert => {"packetsStoD" => "integer"}
   convert => {"bytesStoD" => "integer"}
   convert => {"packetsDtoS" => "integer"}
   convert => {"bytesDtoS" => "integer"}
   split => { "[resourceId]" => "/"}
     add_field => { "Subscription" => "%{[resourceId][2]}"
       "ResourceGroup" => "%{[resourceId][4]}"
       "NetworkSecurityGroup" => "%{[resourceId][8]}"
       }
   convert => {"Subscription" => "string"}
   convert => {"ResourceGroup" => "string"}
   convert => {"NetworkSecurityGroup" => "string"}
   remove_field => [ "[resourceId]" ]
   remove_field => [ "message" ]
   copy => { "sourceAddress" => "sourceHost" }
   copy => { "destinationAddress" => "destinationHost" }
 }
  date{
    match => ["startTime" , "UNIX"]
  }
 translate {
      field => "destinationPort"
      destination => "destinationServiceName"
      dictionary_path => '/etc/logstash/dictionary.d/iana_service_names_tcp.yml'
    }
 translate {
      field => "destinationPort"
      destination => "destinationServiceName"
      dictionary_path => '/etc/logstash/dictionary.d/custom_service_names_tcp.yml'
    }
  cidr {
    address => [ "%{[sourceAddress]}" ]
    network => [ "0.0.0.0/32", "10.0.0.0/8", "172.16.0.0/12", "192.168.0.0/16", "fc00::/7", "127.0.0.0/8", "::1/128","169.254.0.0/16", "fe80::/10","224.0.0.0/4", "ff00::/8","255.255.255.255/32" ]
    add_field => { "[sourceLocality]" => "private" }
  }
  if [sourceLocality] != "private" {
    geoip {
      source => "[sourceAddress]"
          }
  }
#  if [sourceLocality] == "private" {
   dns {
     reverse => [ "sourceHost" ]
     action => "replace"
     hit_cache_size => 10000
     hit_cache_ttl => 3000
     failed_cache_size => 2000
     failed_cache_ttl => 600
   }
#   }
  dns {
    reverse => [ "destinationHost" ]
    action => "replace"
    hit_cache_size => 10000
    hit_cache_ttl => 3000
    failed_cache_size => 2000
    failed_cache_ttl => 600
  }
  translate {
    field => "sourceAddress"
    destination => "sourceAddressMaliciousIP"
    dictionary_path => '/etc/logstash/dictionary.d/maliciousIP.yaml'
  }
  translate {
    field => "destinationAddress"
    destination => "destinationsAddressMaliciousIP"
    dictionary_path => '/etc/logstash/dictionary.d/maliciousIP.yaml'
  }
  translate {
    field => "sourceAddress"
    destination => "sourceAddressTorExit"
    dictionary_path => '/etc/logstash/dictionary.d/torexit.yaml'
  }
  translate {
    field => "destinationAddress"
    destination => "destinationAddressTorExit"
    dictionary_path => '/etc/logstash/dictionary.d/torexit.yaml'
  }
# Monitoring system IP addresses
  translate {
    field => "sourceAddress"
    destination => "sourceAddressStatusCake"
    dictionary_path => '/etc/logstash/dictionary.d/statuscakeIP.yaml'
  }
  translate {
    field => "destinationAddress"
    destination => "destinationAddressStatusCake"
    dictionary_path => '/etc/logstash/dictionary.d/statuscakeIP.yaml'
  }
 }
}
Logstash pipelines.yml
- pipeline.id: main
  path.config: "/etc/logstash/conf.d/*.conf"
  pipeline.workers: 16
  pipeline.batch.size: 500
Dictionary Files
Example files an scripts to allow download/updating of files are available on GitHub
Screenshots


Data source config
Collector config:
Upload an updated version of an exported dashboard.json file from Grafana
| Revision | Description | Created | |
|---|---|---|---|
| Download |
Azure Cosmos DB
With the Grafana plugin for Azure Cosmos DB, you can quickly visualize and query your Azure Cosmos DB data from within Grafana.
Learn more