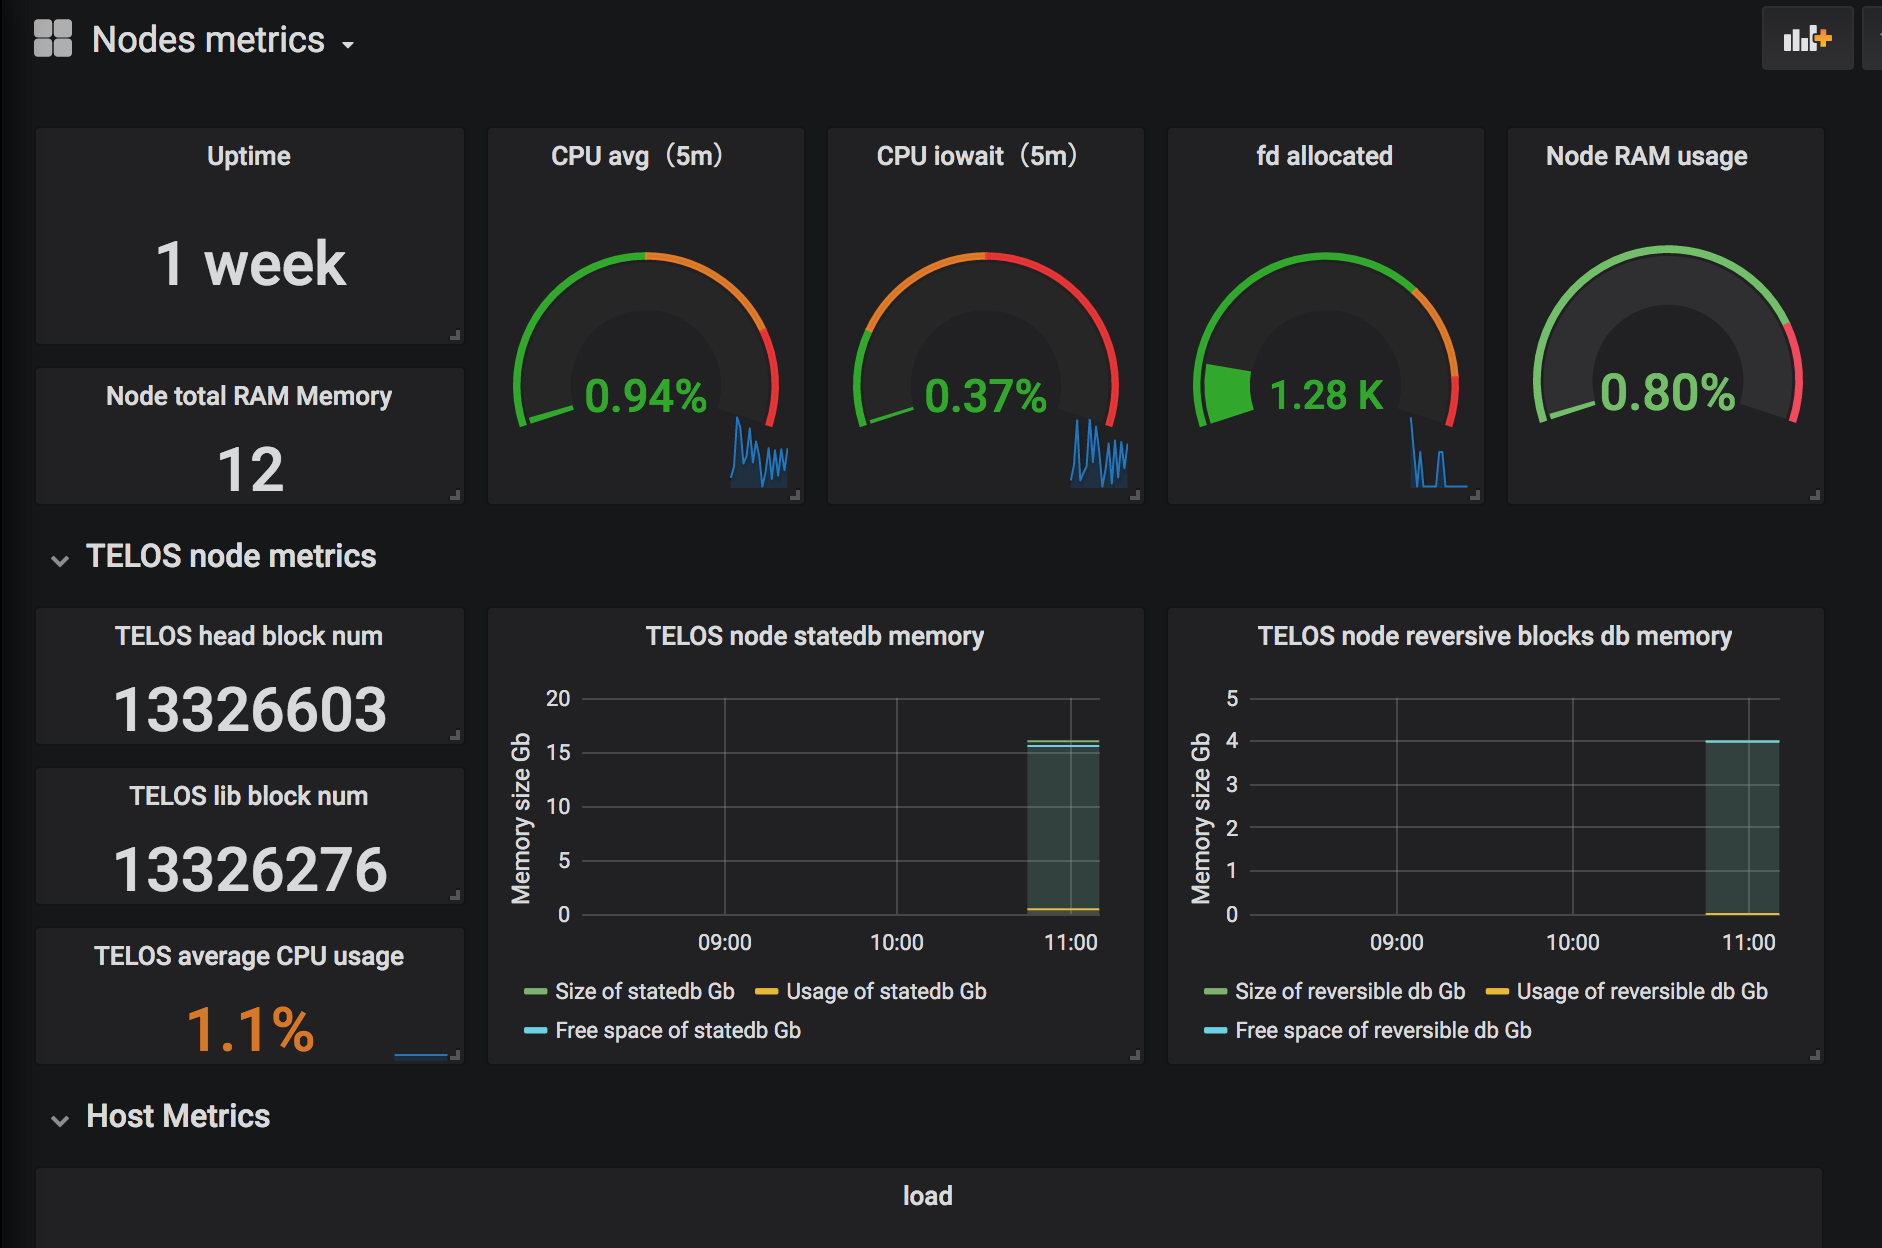
Telos Node Metrics
The following dashboards shows a mixture of EOSIO node metrics from the Telos blockchain and traditional node exporter host metrics.
Install instructions:
This dashboard is based on the excellent work of https://github.com/everstake/eosmon Follow the described readme steps to install the eos_exporter.sh script Note: I modified it myself to not run in a while loop but just run once and let cron do the scheduling work. This specific example dashboard expects you to set the variable KRYPT to tlos and KRNAME to TLOS in eos_exporter.sh
Data source config
Collector config:
Upload an updated version of an exported dashboard.json file from Grafana
| Revision | Description | Created | |
|---|---|---|---|
| Download |
Linux Server
Monitor Linux with Grafana. Easily monitor your Linux deployment with Grafana Cloud's out-of-the-box monitoring solution.
Learn more
