
InfluxDB Internal Basics
InfluxDB Bare Bones Basics internal data explorer. + Lists Databases + Lists Measurements + Lists Retention policies + Lists Series + Lists Field Keys + Lists Tag Keys + Lists Tag Values
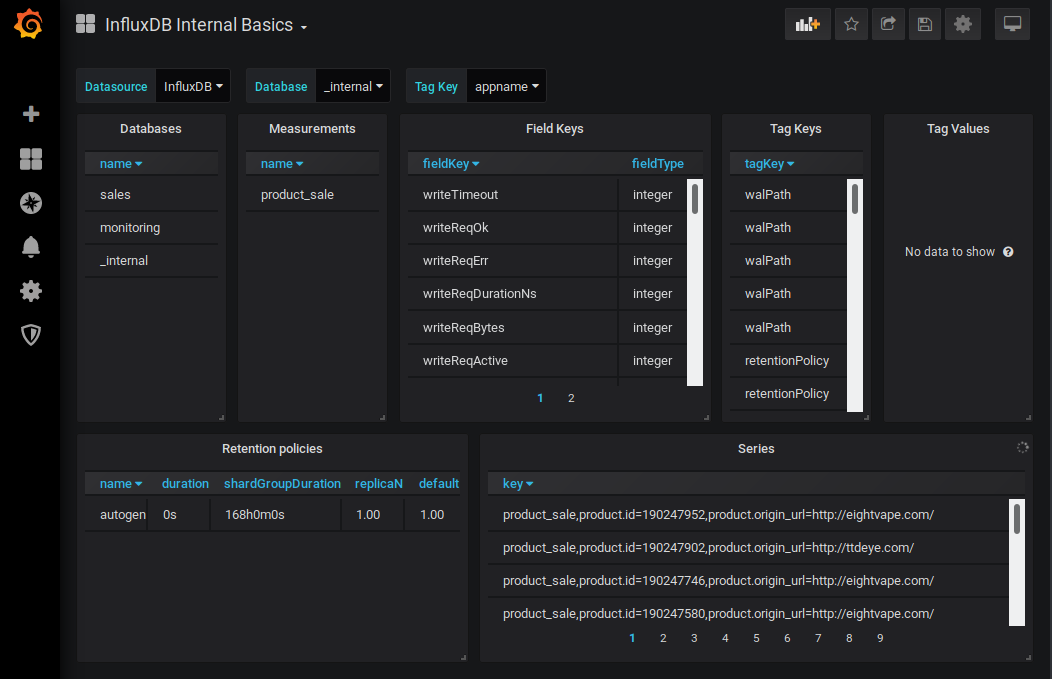
TLDR; The main feature of this dashboard is that it shows data WITHOUT ANY CONFIGURATION for any InfluxDB instance.
Introduction
This is the first dashboard I install every time I use Grafana with InfluxDB. In my opinion it should have been installed by default, or have been made available built into the "data explorer" tool. Why? Because I keep forgetting all the InfluxDB terms. What are tags, fields, series, retention policies and measurements? Am I supposed to just know that?
Features
For the selected datasource:
- Lists Databases
- Lists Measurements
- Lists Retention policies
- Lists Series
For the selected datasource and database
- Lists Field Keys
- Lists Tag Keys
For the selected datasource, database and tag_key
- Lists Tag Values
From this starting point you should be perfectly capable to browse your data further and create wonderful queries :D
Data source config
Collector config:
Upload an updated version of an exported dashboard.json file from Grafana
| Revision | Description | Created | |
|---|---|---|---|
| Download |
InfluxDB
Easily monitor InfluxDB, an open source time series database, with Grafana Cloud's out-of-the-box monitoring solution.
Learn more