Server Power Usage PowerEdge r710
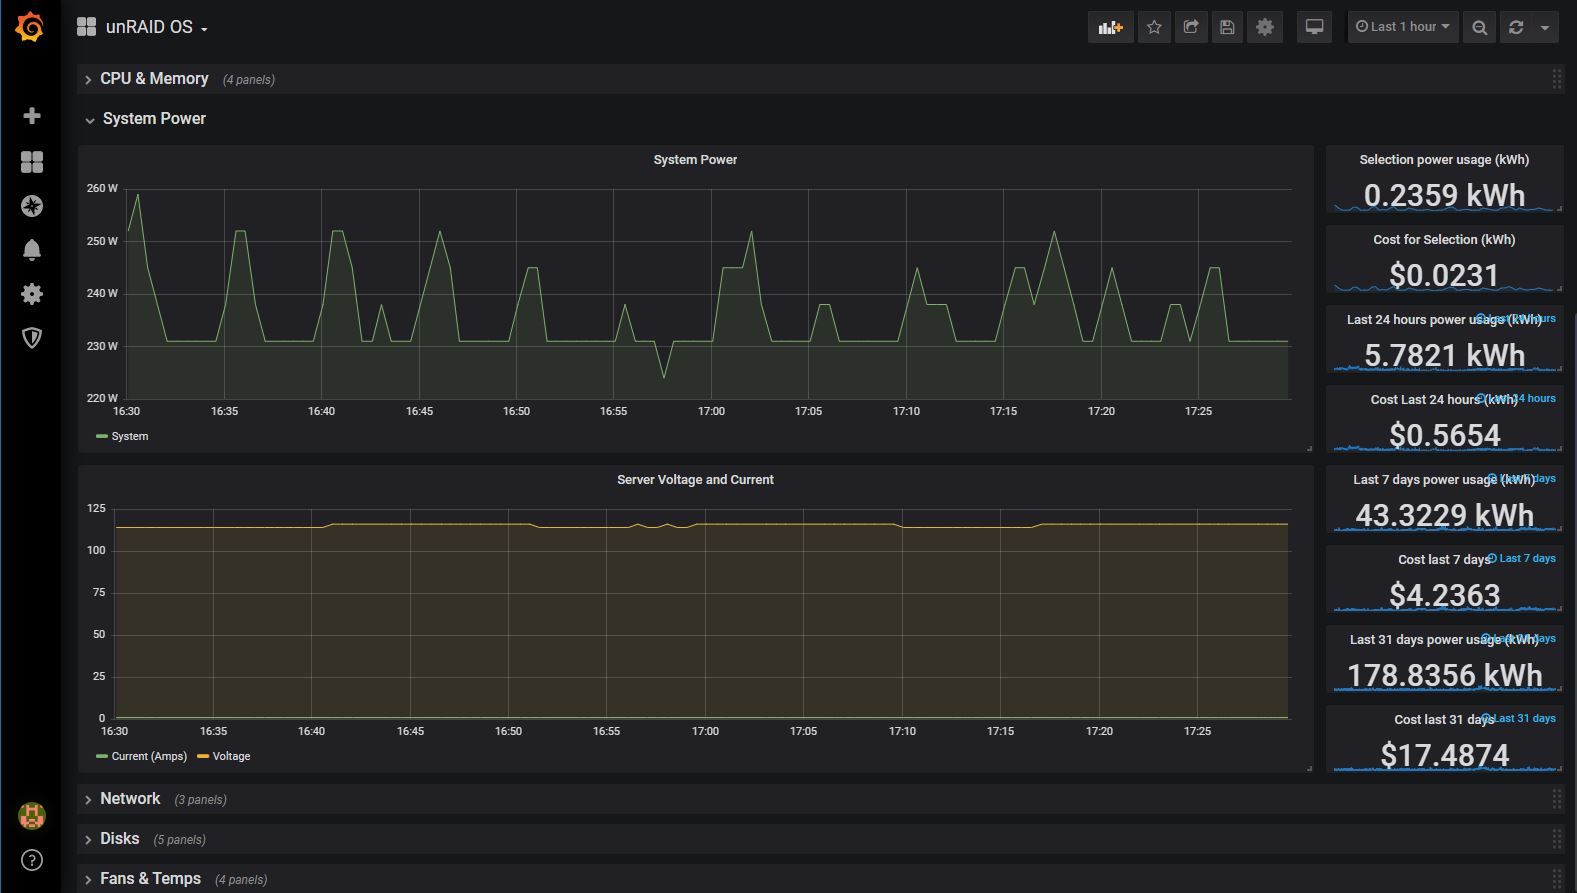
Dashboard for viewing your PowerEdge r710 usgae over time. Should also work with other systems using the iDRAC6 that expose the same information over IPMI. Requires Influxdb, Telegraf, and a supported system.
Server Power Usage
Dashboard for viewing your PowerEdge r710 usgae over time. Should also work with other systems using the iDRAC6 that expose the same information. Requires Influxdb, Telegraf, and a supported system.
The boxes on the right will break down the total usage and cost over the selction, lasr 24 hours, last week, and last 30 days. This makes it easy to see the costs over time.
Setup
I created a post explaining how to set this up here: https://skylar.tech/graphing-poweredge-r710-power/
Data source config
Collector config:
Upload an updated version of an exported dashboard.json file from Grafana
| Revision | Description | Created | |
|---|---|---|---|
| Download |

