
Cluster Monitoring for PKS
This dashboard provides cluster admins with the ability to monitor nodes and identify workload bottlenecks on PKS. Depends on ClusterMetricSinks (available in PKS 1.5). For more information on using this dashboard see https://docs.pivotal.io/reliability-view/v0.3/common-configurations.html#monitoring-pks-cluster-metrics.
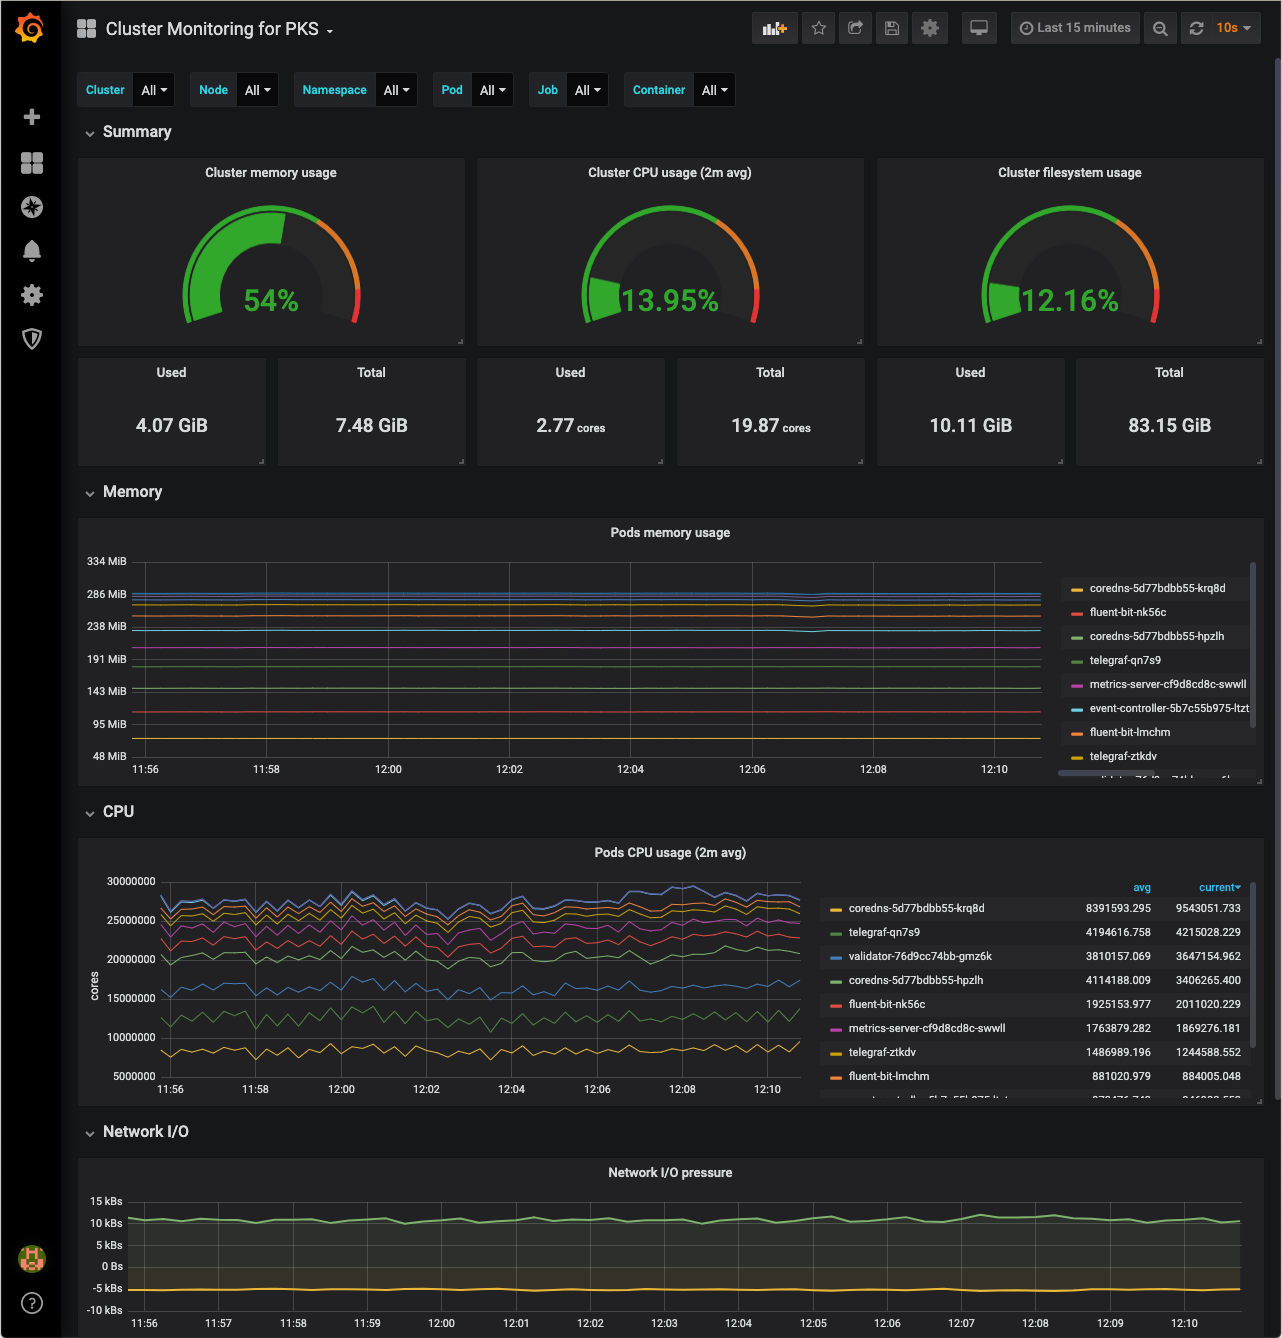
The Cluster Monitoring for PKS dashboard uses the prometheus data source to create a Grafana dashboard with the graph and singlestat panels.
Data source config
Collector type:
Collector plugins:
Collector config:
Revisions
Upload an updated version of an exported dashboard.json file from Grafana
| Revision | Description | Created | |
|---|---|---|---|
| Download |