Host Detailed Dashboard
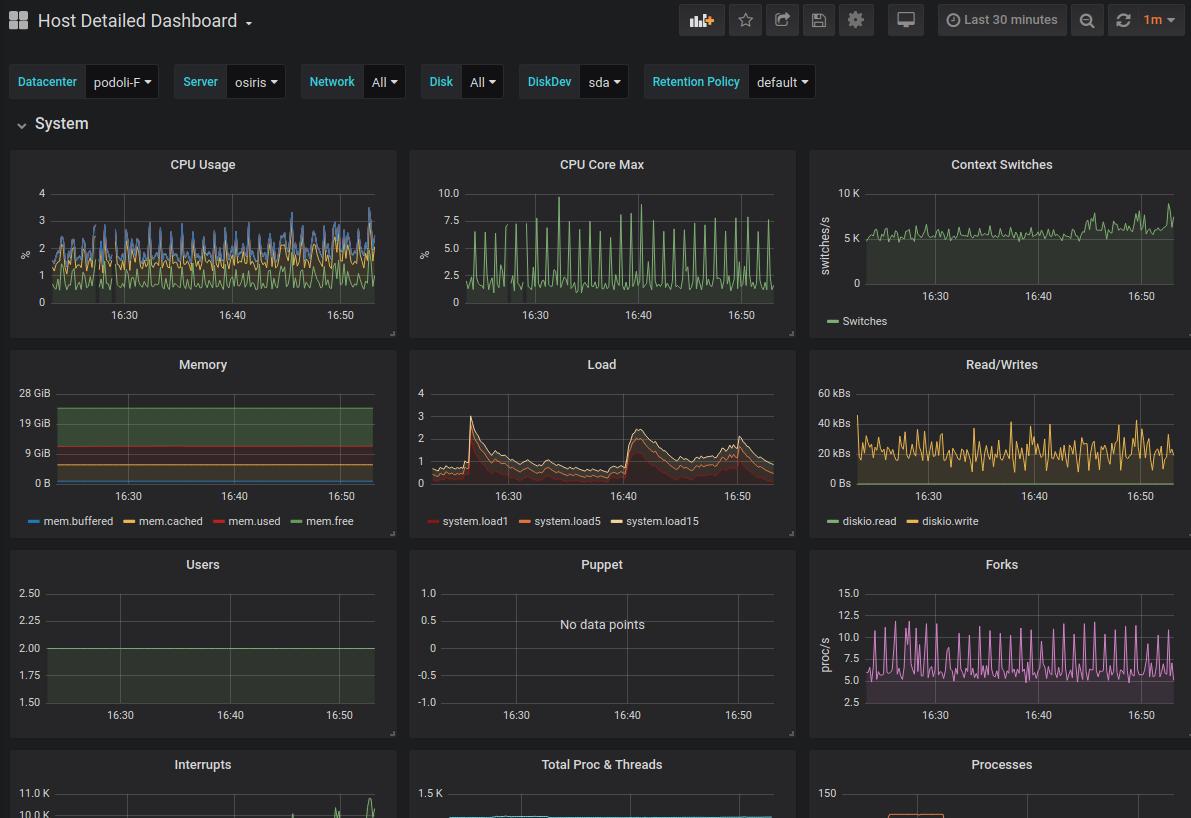
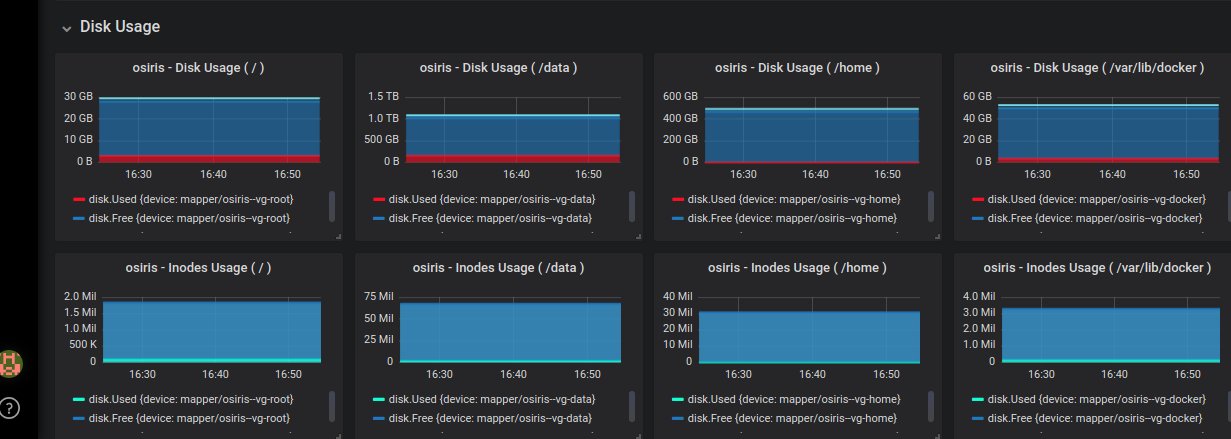
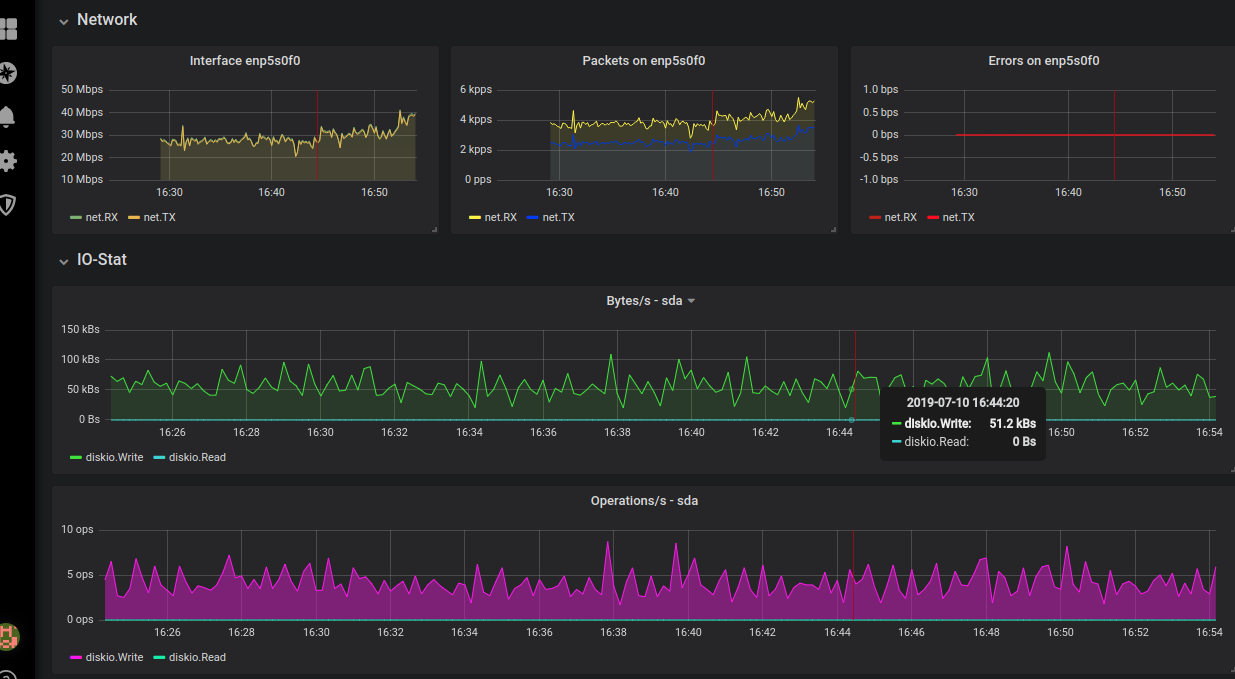
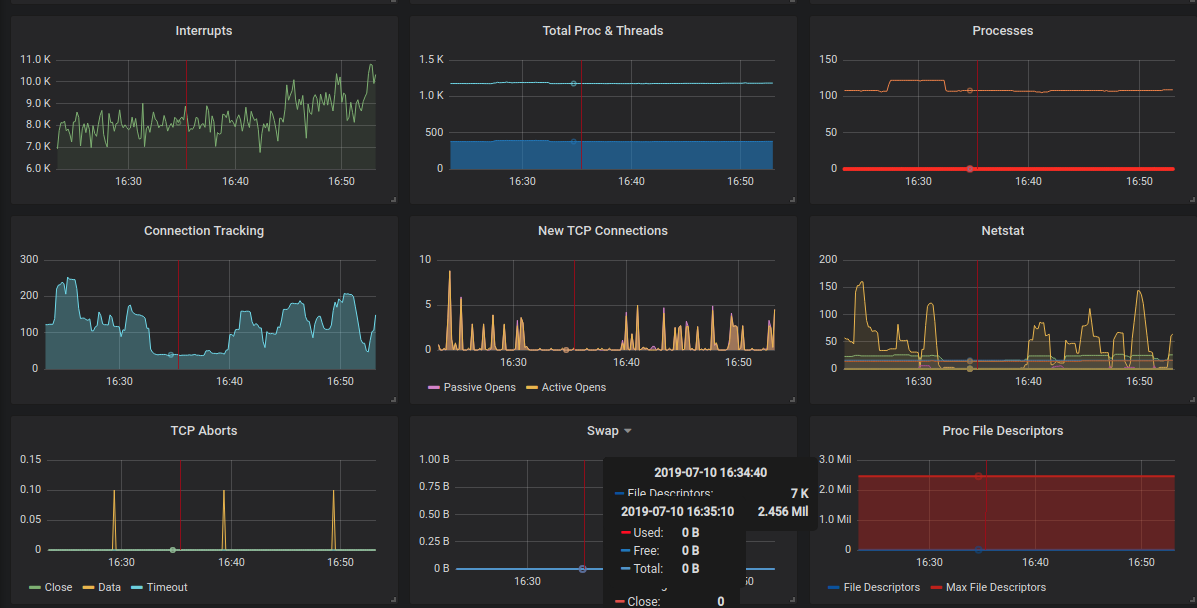
Very detailed host dashboard. It shows stats for Disk, Kernel, Network and process stuff. Used every day for debugging purposes.
About
This dashboard gives you pretty much detailed overview of your host. It uses DC tag to switch between location or Datacenter rooms.
You have to set dc global tag in your telegraf.conf. You can implement it to your automatic configuration management and generate it for you.
Requirements
- InfluxDB as backend service
- Telegraf collector installed on your system
Features
- Retention policies
- Filter with DC (datacenter) tag
- Disk and Network selectors
Data source config
Collector config:
Upload an updated version of an exported dashboard.json file from Grafana
| Revision | Description | Created | |
|---|---|---|---|
| Download |


