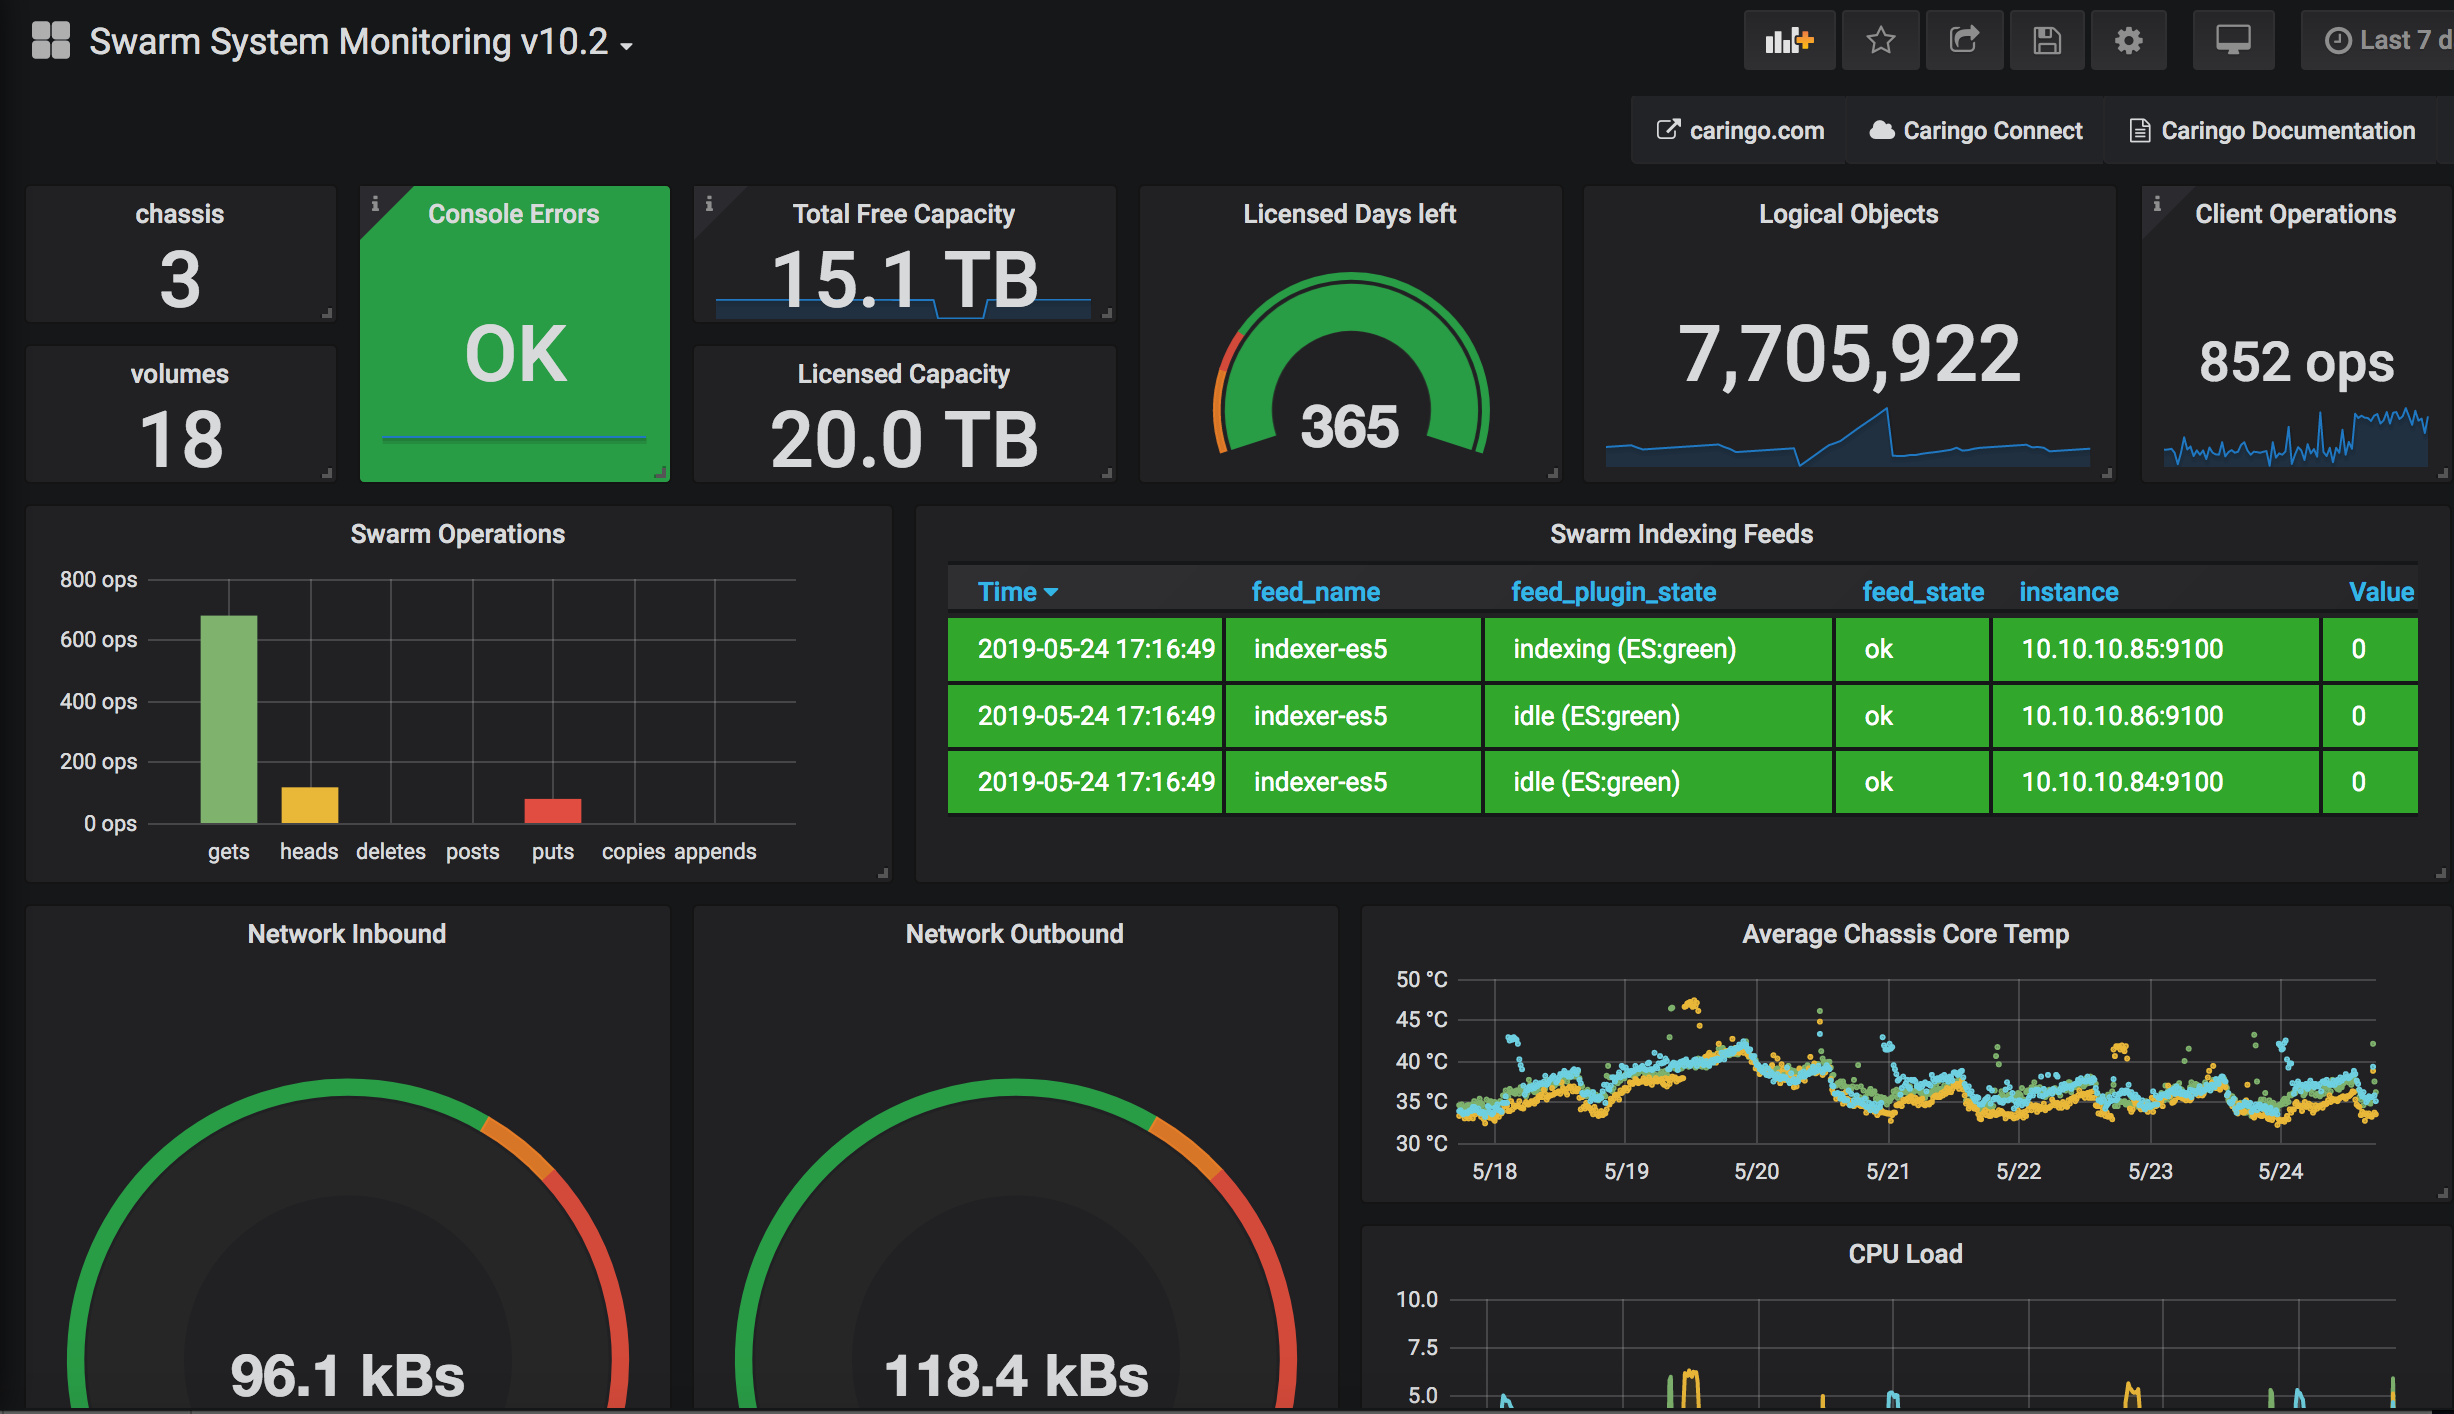
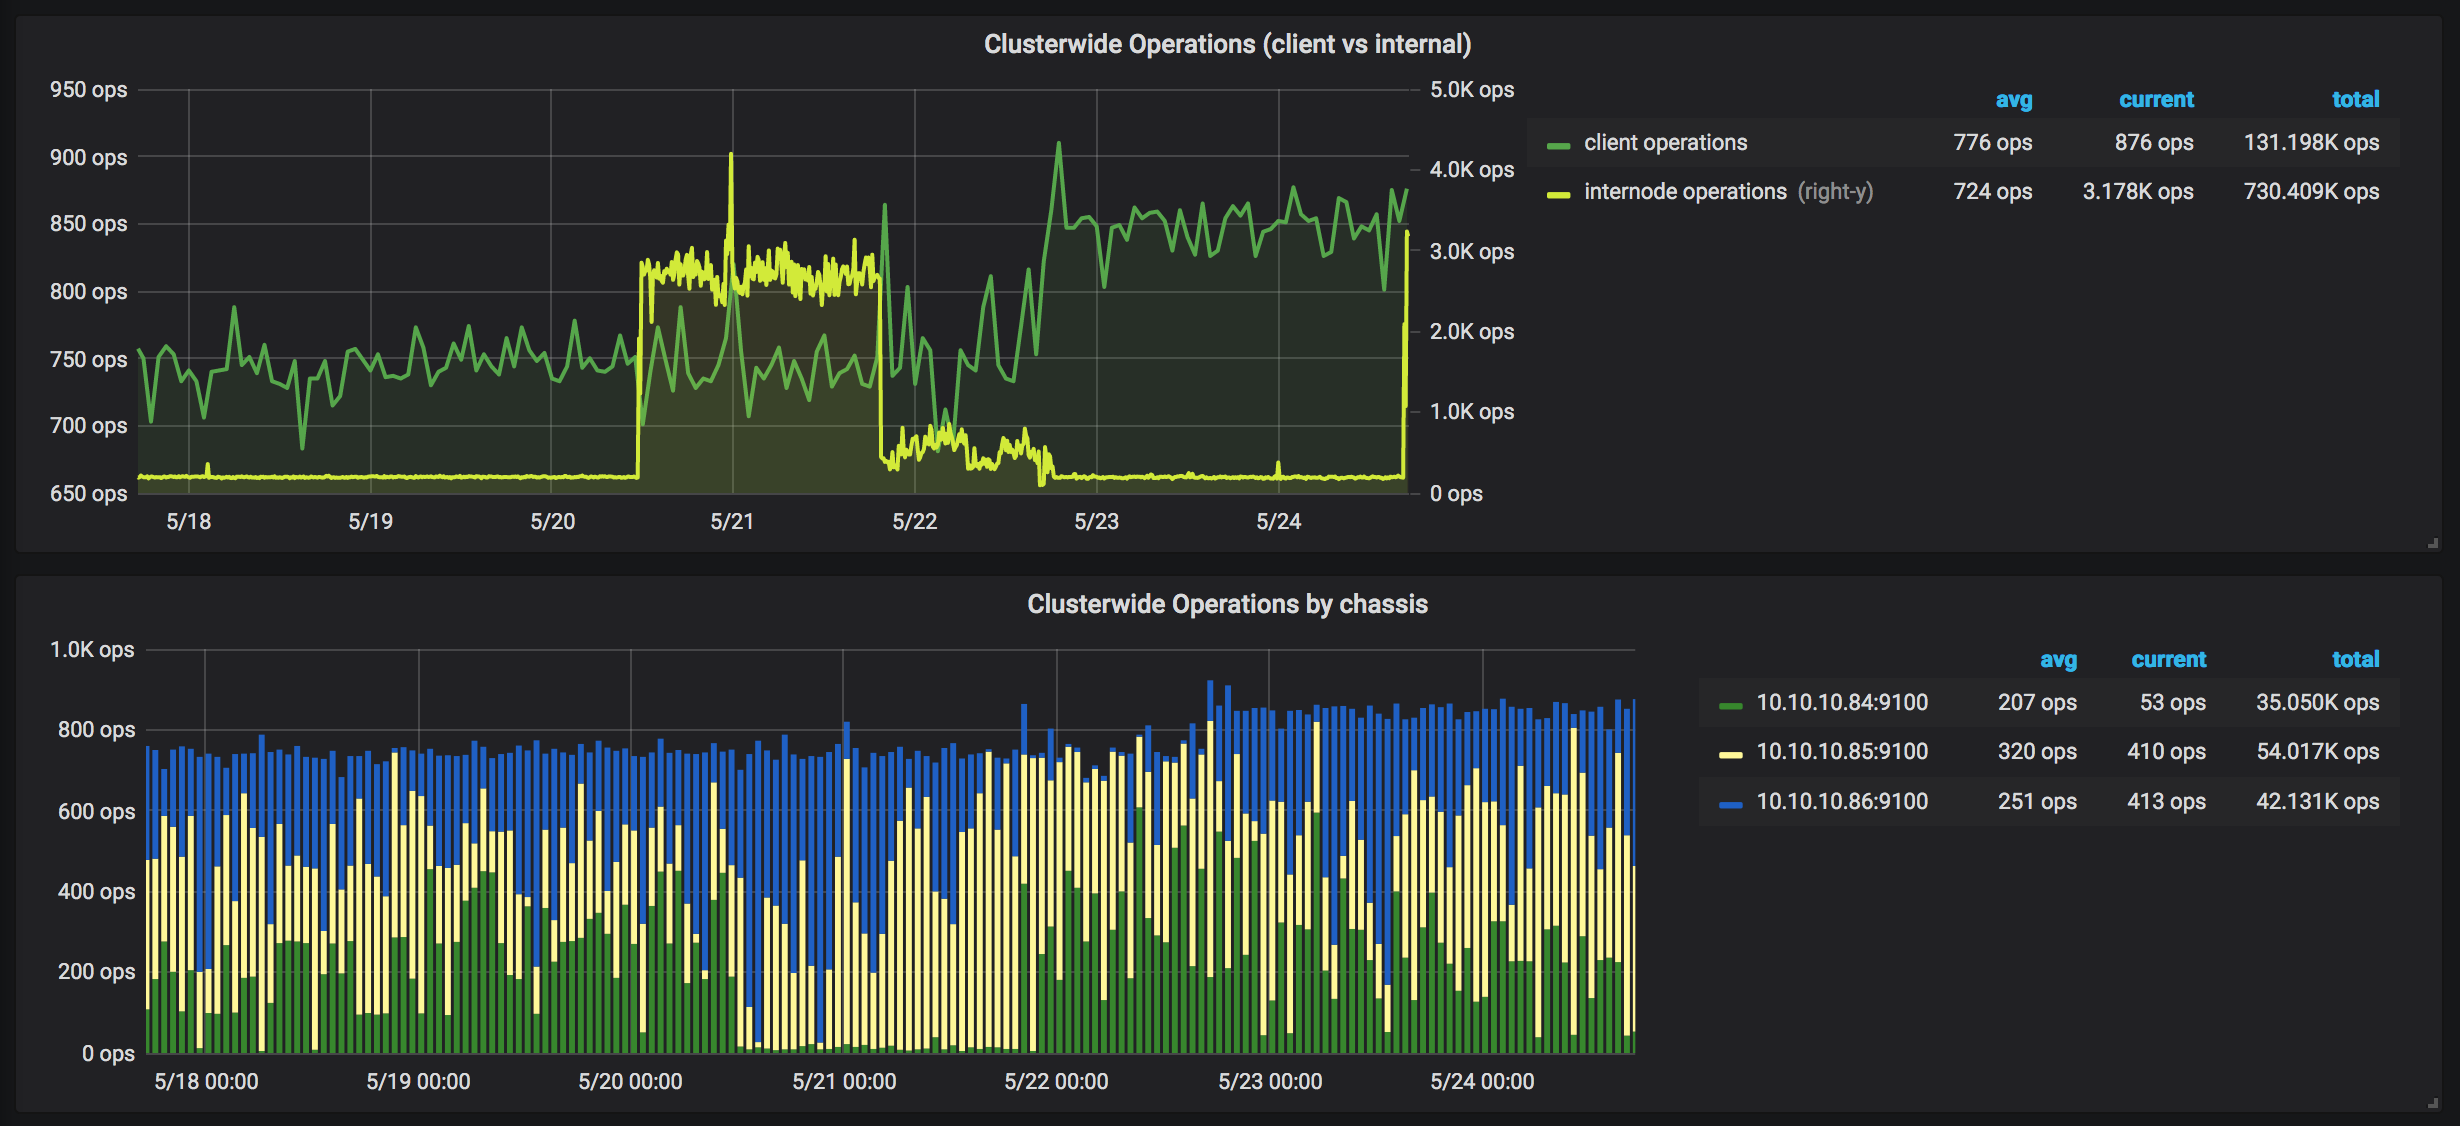
Caringo Swarm System Monitoring v10.2
Example Dashboard to monitor Caringo Swarm v10.2 and higher
This dashboard is an example of how to visualize metrics provided by Caringo Swarm v10.2 and above. See Caringo documentation on instructions for enabling Swarm metrics.
All Swarm metrics are prefixed by the keyword "metrics_"
Changelog:
- Revision 2: fixed datasource configuration error for the "swarm operations" panel
Data source config
Collector config:
Upload an updated version of an exported dashboard.json file from Grafana
| Revision | Description | Created | |
|---|---|---|---|
| Download |


