
Mellanox - What Just Happened? Monitoring
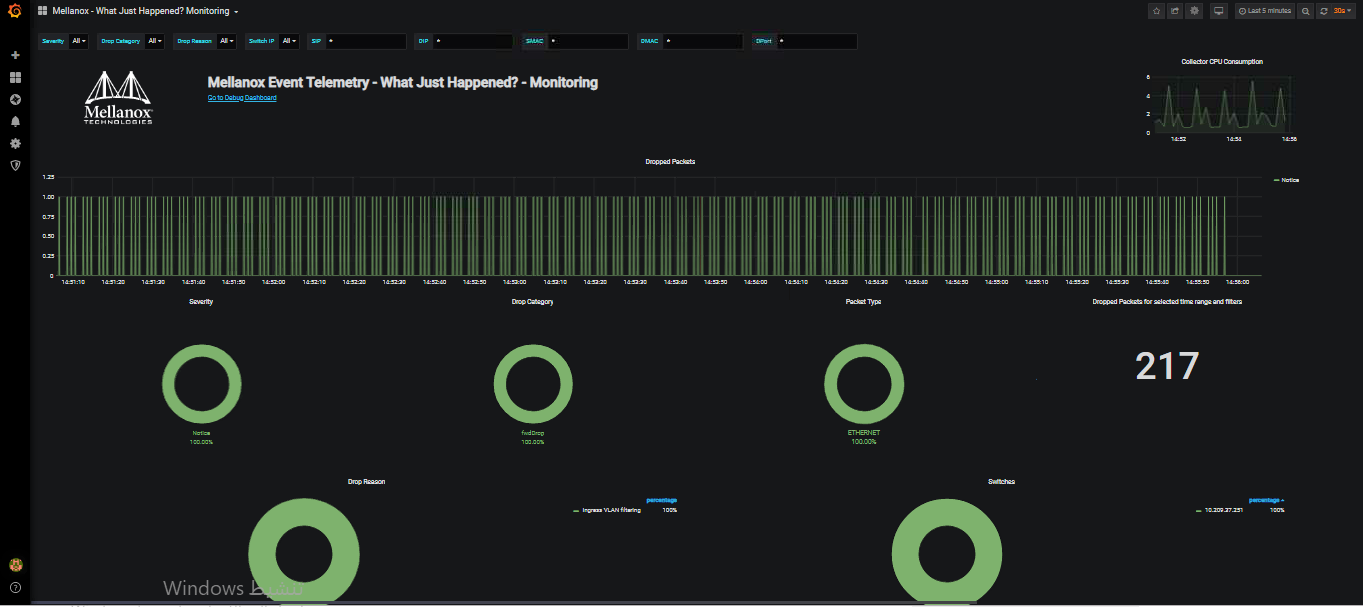
The Monitoring Dashboard provides a real-time pane for monitoring "What Just Happened?" activity in the network.
Data source config
Collector type:
Collector plugins:
Collector config:
Revisions
Upload an updated version of an exported dashboard.json file from Grafana
| Revision | Description | Created | |
|---|---|---|---|
| Download |