wjh_debug_image.PNG wjh_debug_image2.PNG
Products
The Grafana Stack
Pricing
Learn
Stay Up To Date
Technical Learning
Join The Community
Company
Help build the future of open source observability software Open positions
Check out the open source projects we support Downloads
Products
Open source Grafana Prometheus Grafana Loki Grafana Mimir Grafana OnCall Grafana Tempo Graphite Grafana k6 OpenTelemetry
Learn
Company Our team Careers Partnerships Newsroom Contact us
Open source Grafana Prometheus Grafana Loki Grafana Mimir Grafana OnCall Grafana Tempo Graphite Grafana k6 OpenTelemetry
Learn
Company Our team Careers Partnerships Newsroom Contact us
Get Started
Free Forever plan:
- 10,000 series metrics
- 14-day retention
- 50 GB of logs
- 50 GB of traces
- 3 team members
- Grafana, of course
- All dashboards
- Mellanox - What Just Happened? Debug
Mellanox - What Just Happened? Debug
by hanady
Dashboard
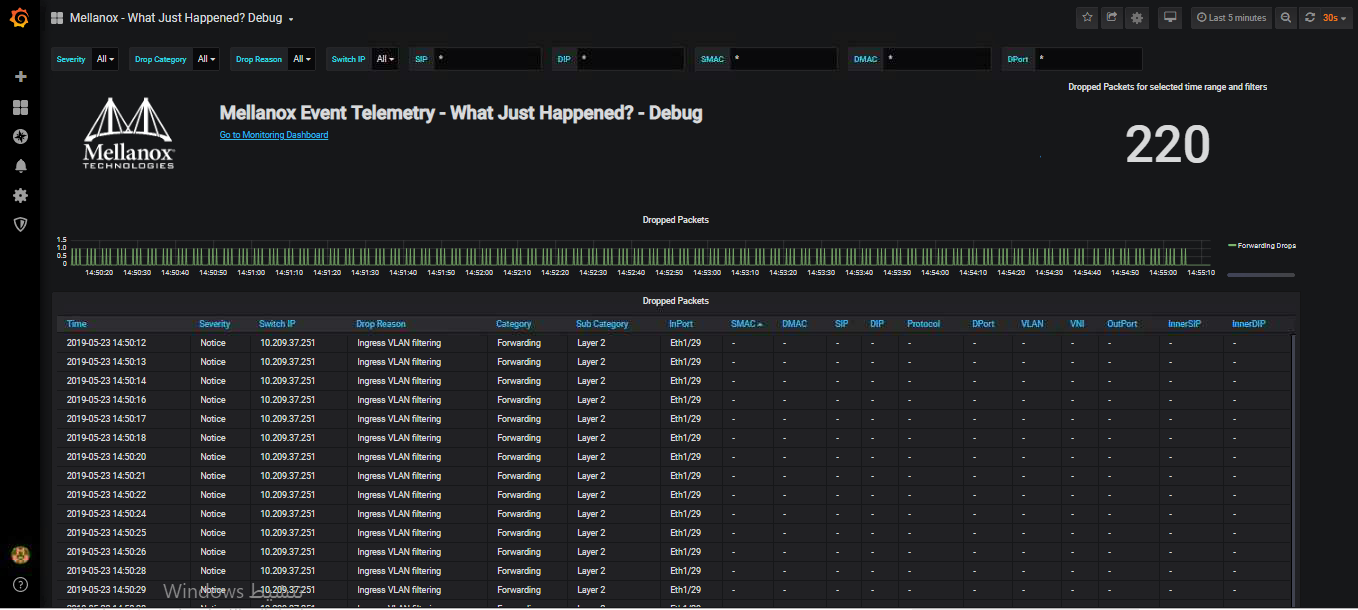
The Debug Dashboard allows users to receive detailed information about all the recorded "What Just Happened?" drops. It includes a graph of dropped packets per time and a detailed table of dropped packets.
Last updated: 3 years ago
Dependencies:
Grafana 6.2.0-beta2
Graph (old)
InfluxDB 1.0.0
Singlestat
Table
Text
Data Sources:
Categories:
Copyright 2022 © Grafana Labs