influxDB-flink
flink in influxDB
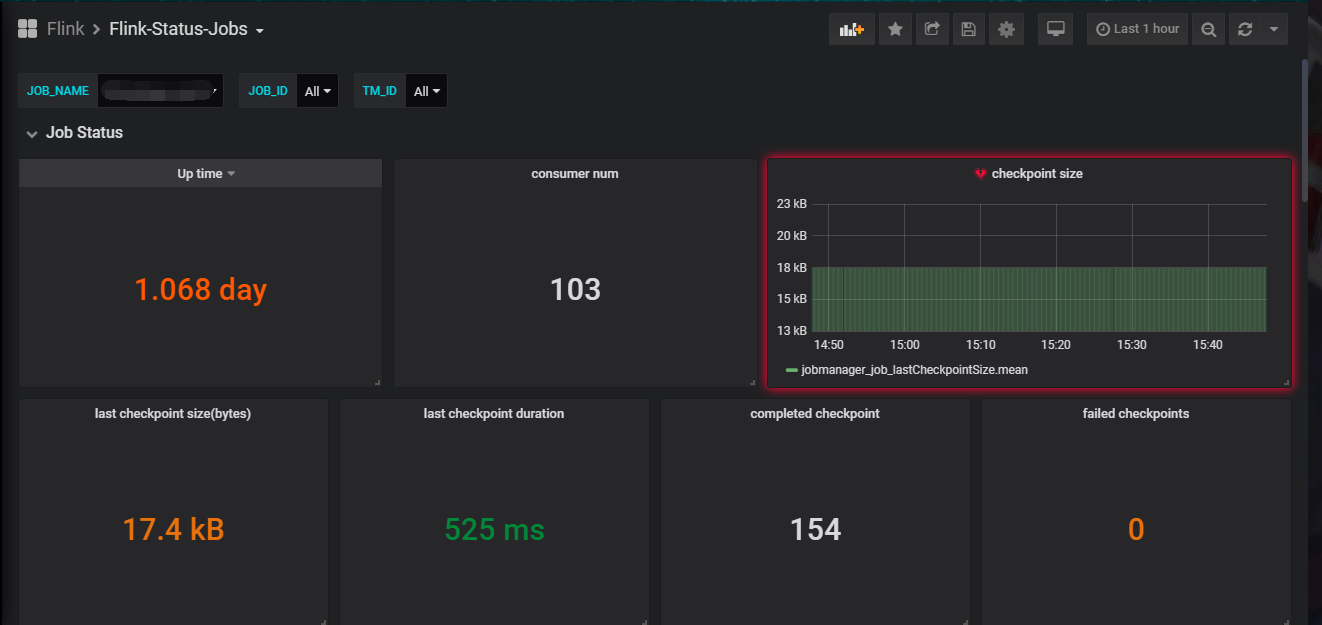
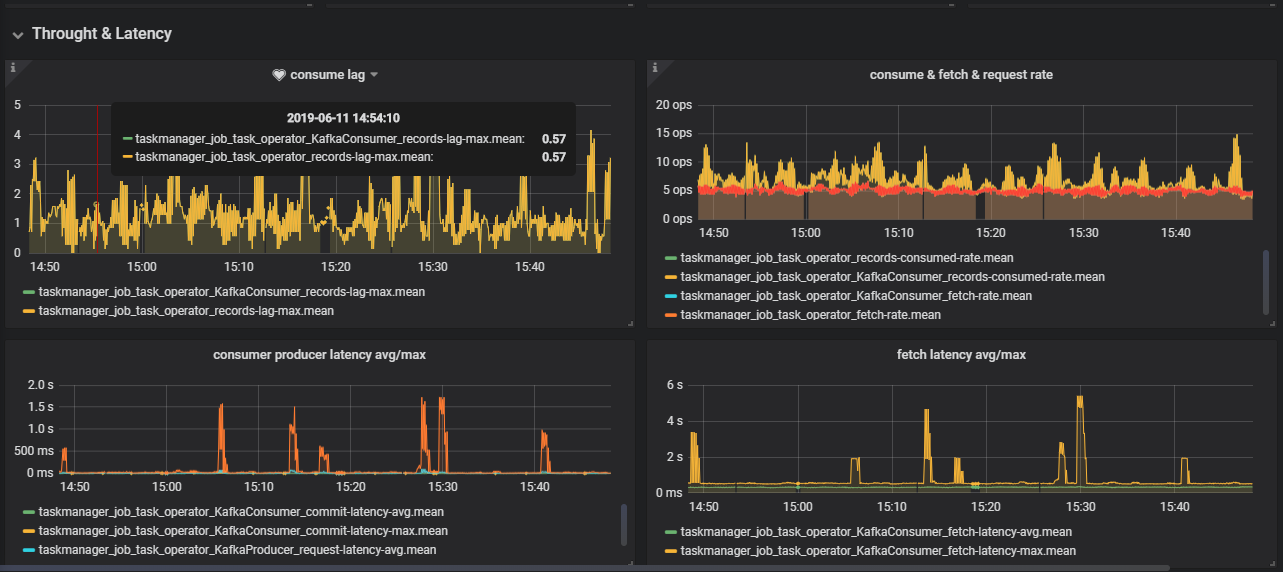
Flink metrics in YARN mode. This dashboard is used to monitor the Throghtput & Latency,Job Status,Alerting,Source&Sink Info metrics for all Flink Jobs. update(20190611):Users can search flink job via job_name.
Data source config
Collector config:
Upload an updated version of an exported dashboard.json file from Grafana
| Revision | Description | Created | |
|---|---|---|---|
| Download |
InfluxDB
Easily monitor InfluxDB, an open source time series database, with Grafana Cloud's out-of-the-box monitoring solution.
Learn more

