What you'll learn
- Visualizing data and performing analytics on that data in one place, without storing it in another place.
- Querying, visualizing, and alerting on metrics stored in almost any data source.
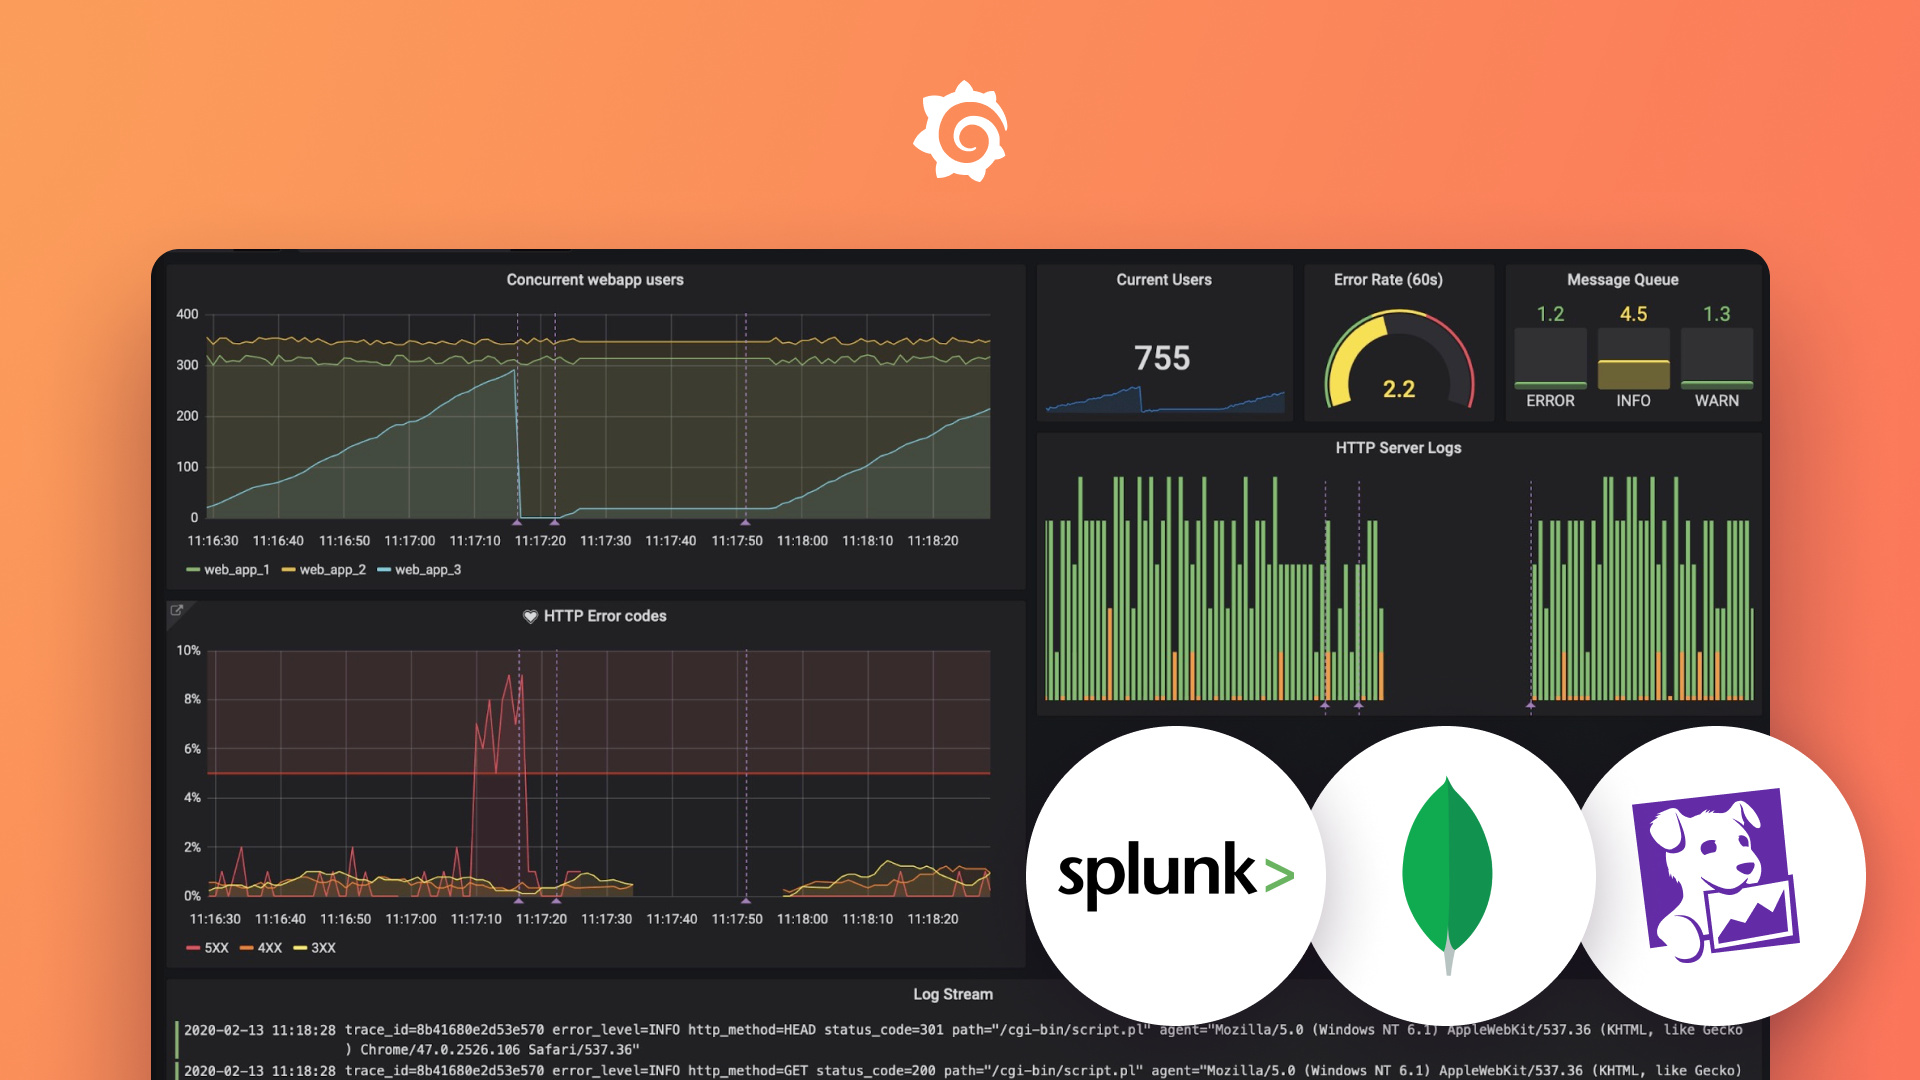
- Using Grafana’s plugin architecture, which offers instant access to 300+ data sources, including Enterprise plugins for Elasticsearch, Jira, Datadog, Splunk, AppDynamics, Oracle, MongoDB, Snowflake, ServiceNow, and more.
- Using Grafana to lower MTTI/MTTR.
Does having multiple tabs open for different tools in order to troubleshoot a problem sound like your current reality? In this webinar, we’ll walk through Grafana dashboards that eliminate the need for all those tabs, allowing you to track in one place, in real time, service KPIs such as availability and health. If one of those key services is degraded, you can drill down to find out why, leading to faster MTTR.
Leveraging Grafana’s robust plugin ecosystem, this unified data approach is drastically more efficient because instead of having to manually correlate data between tools, you can have Grafana automatically correlate the timestamps across your tools on your behalf. This is especially helpful when sourcing data about your systems from multiple different tools.
Additional resources to explore:
Your guide
