What you'll learn
- How to use prebuilt Grafana dashboards to get visibility into metrics growth
- How to attribute costs to different teams and services
- Techniques to identify and drop unused metrics and labels in your environment
- Proactively monitor and report through Grafana dashboards and alerts
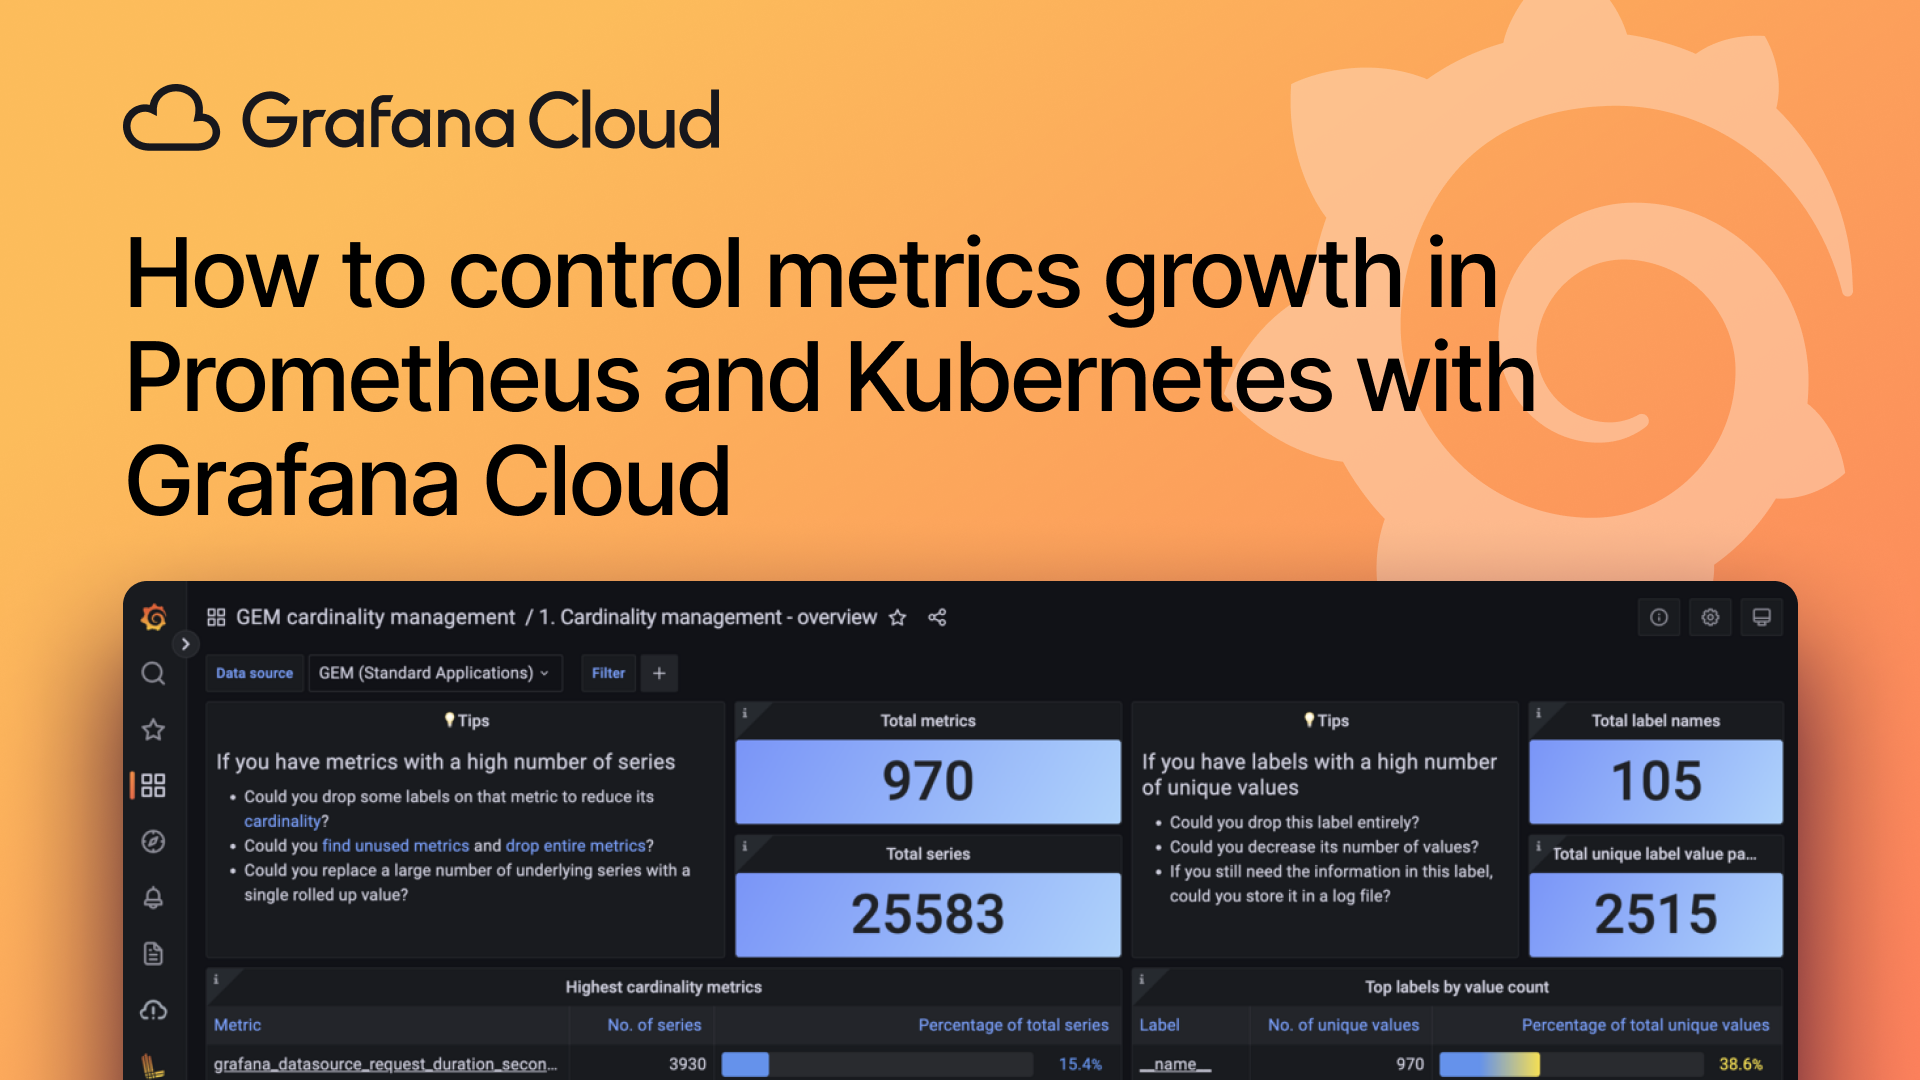
Managing rising metrics costs and cardinality with Grafana Cloud
The alarming rate at which observability data is growing as businesses scale, transition to cloud native architectures, and adopt Prometheus and Kubernetes has become top of mind for SRE and DevOps teams. As the number of metrics increases, so does the compute costs to store and retrieve the data. The inability to predict the growth of metrics data can then result in unexpected overage costs, which in turn can negatively impact planning, delivery, and service reliability.
For centralized observability teams struggling with cardinality spikes, this webinar will introduce a metrics cost management framework to optimize metrics growth while keeping rising costs at bay. We will walk you through a hands-on demo showcasing new features and functionalities that help manage your stack in Grafana Cloud, from out-of-the-box Grafana dashboards for usage and cardinality analysis to the ability to allocate and attribute costs to specific teams.
Additional resources to explore:
Your guides