What you'll learn
- How Grafana 8 alerting compares to the old Grafana dashboard alerts
- How Grafana 8 alerting greatly improves upon Grafana Cloud alerting and complex Prometheus-style alerts
- How to create and interact with an alert in Grafana 8
- Awesome new features of Grafana 8 alerting
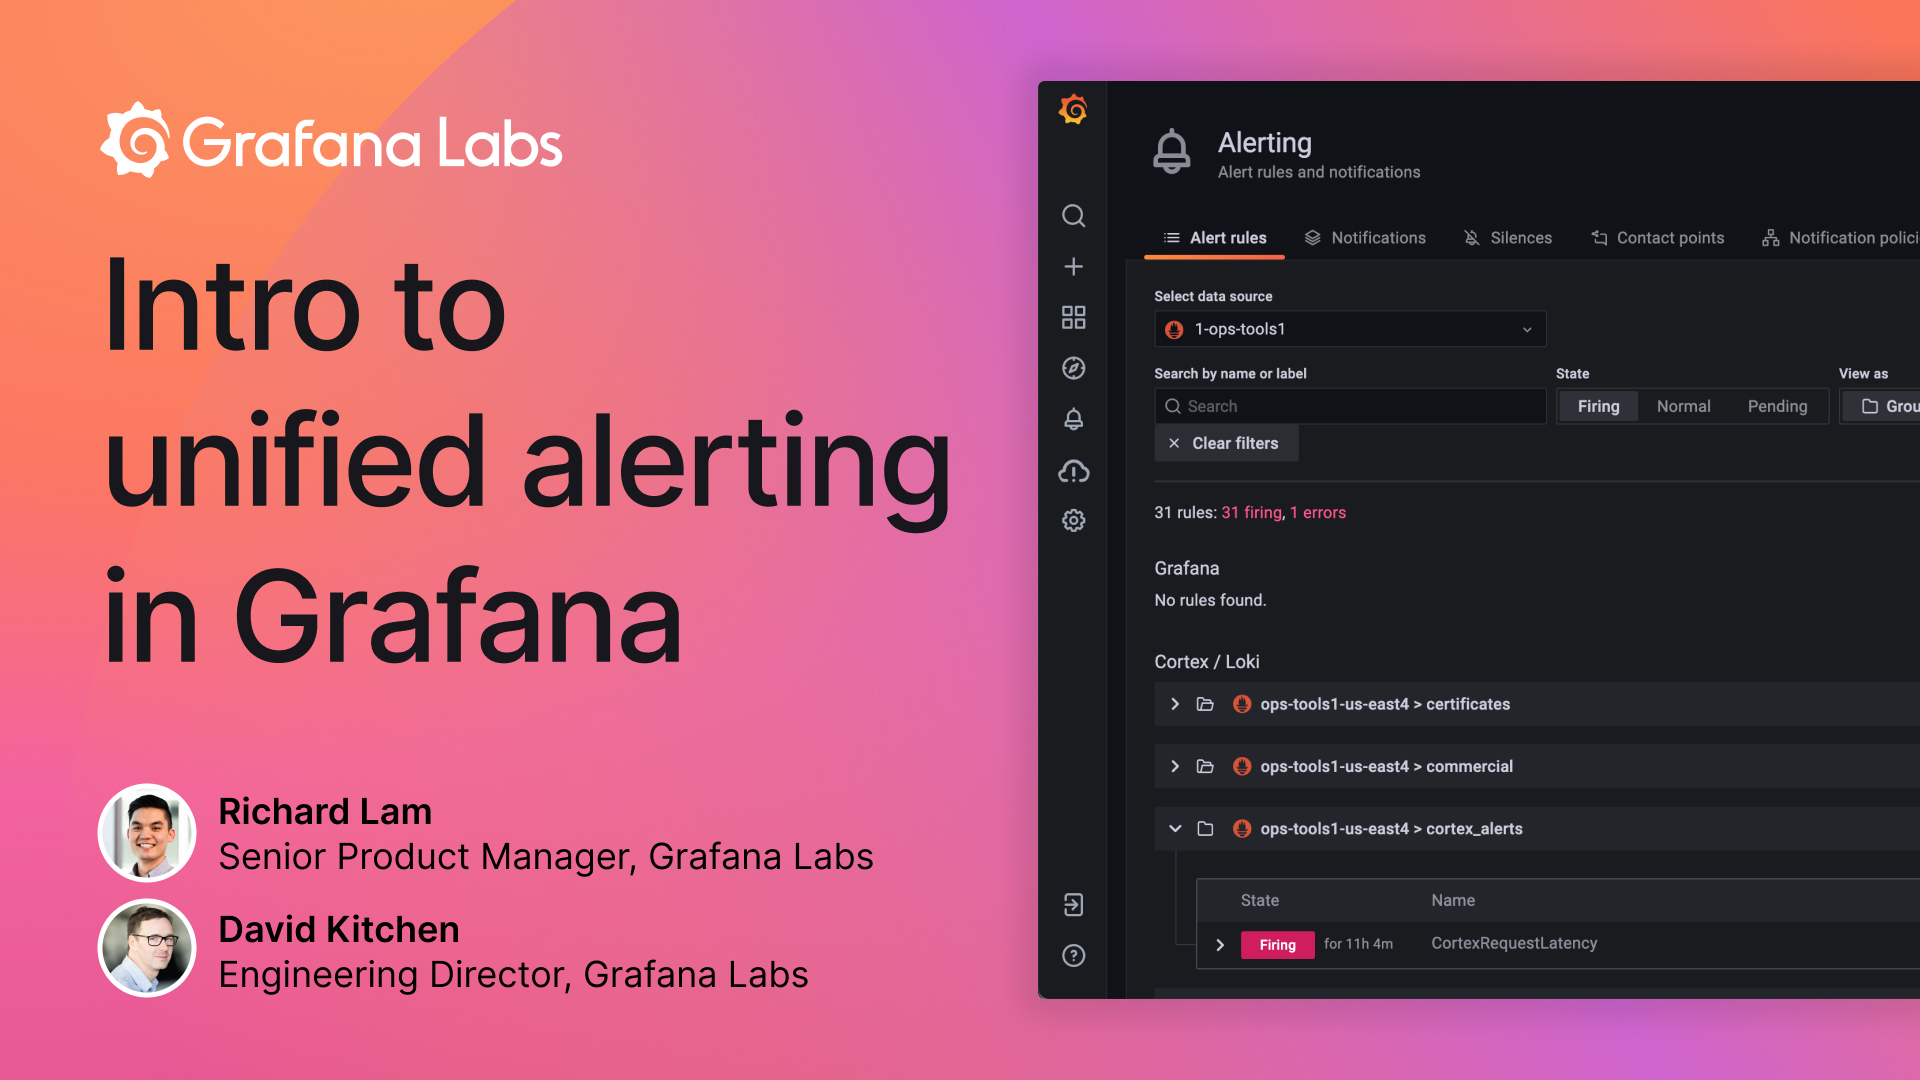
In this webinar, we’ll give you a walkthrough and introduction of the Grafana 8 unified alerting system that was announced at GrafanaCONline. For users of the old traditional Grafana dashboard alerts, we’ll talk about what you can expect as you migrate to the new system, as well as some of the improvements we’ve made along the way. For users of Prometheus-style alerts and Grafana Cloud alerting, we’ll also explore how the new system makes it easier than ever to manage these alerts, all directly within Grafana.
Your guides

Richard Lam
Product Director
Grafana Labs

Dee Kitchen
VP, Engineering
Grafana Labs