
What you'll learn
- The importance of metrics as part of your observability strategy
- The challenges that come up when scaling metrics
- The different offerings Grafana Labs provides for metrics observability including Prometheus, Graphite, Grafana Cloud Metrics, Grafana Enterprise Metrics and more
- How to get started with Grafana Cloud using your existing metrics system
Grafana Labs provides a simple and scalable solution for unifying your metrics across multiple systems, enabling both real-time and historical analysis in Grafana Cloud or self-hosted on your own infrastructure.
In this webinar, we’ll talk about some of the challenges users encounter when scaling their metrics systems, with a particular focus on Prometheus and Graphite. Then we’ll cover how Grafana Labs helps organizations address these problems so they can easily store, query, and manage their metrics.
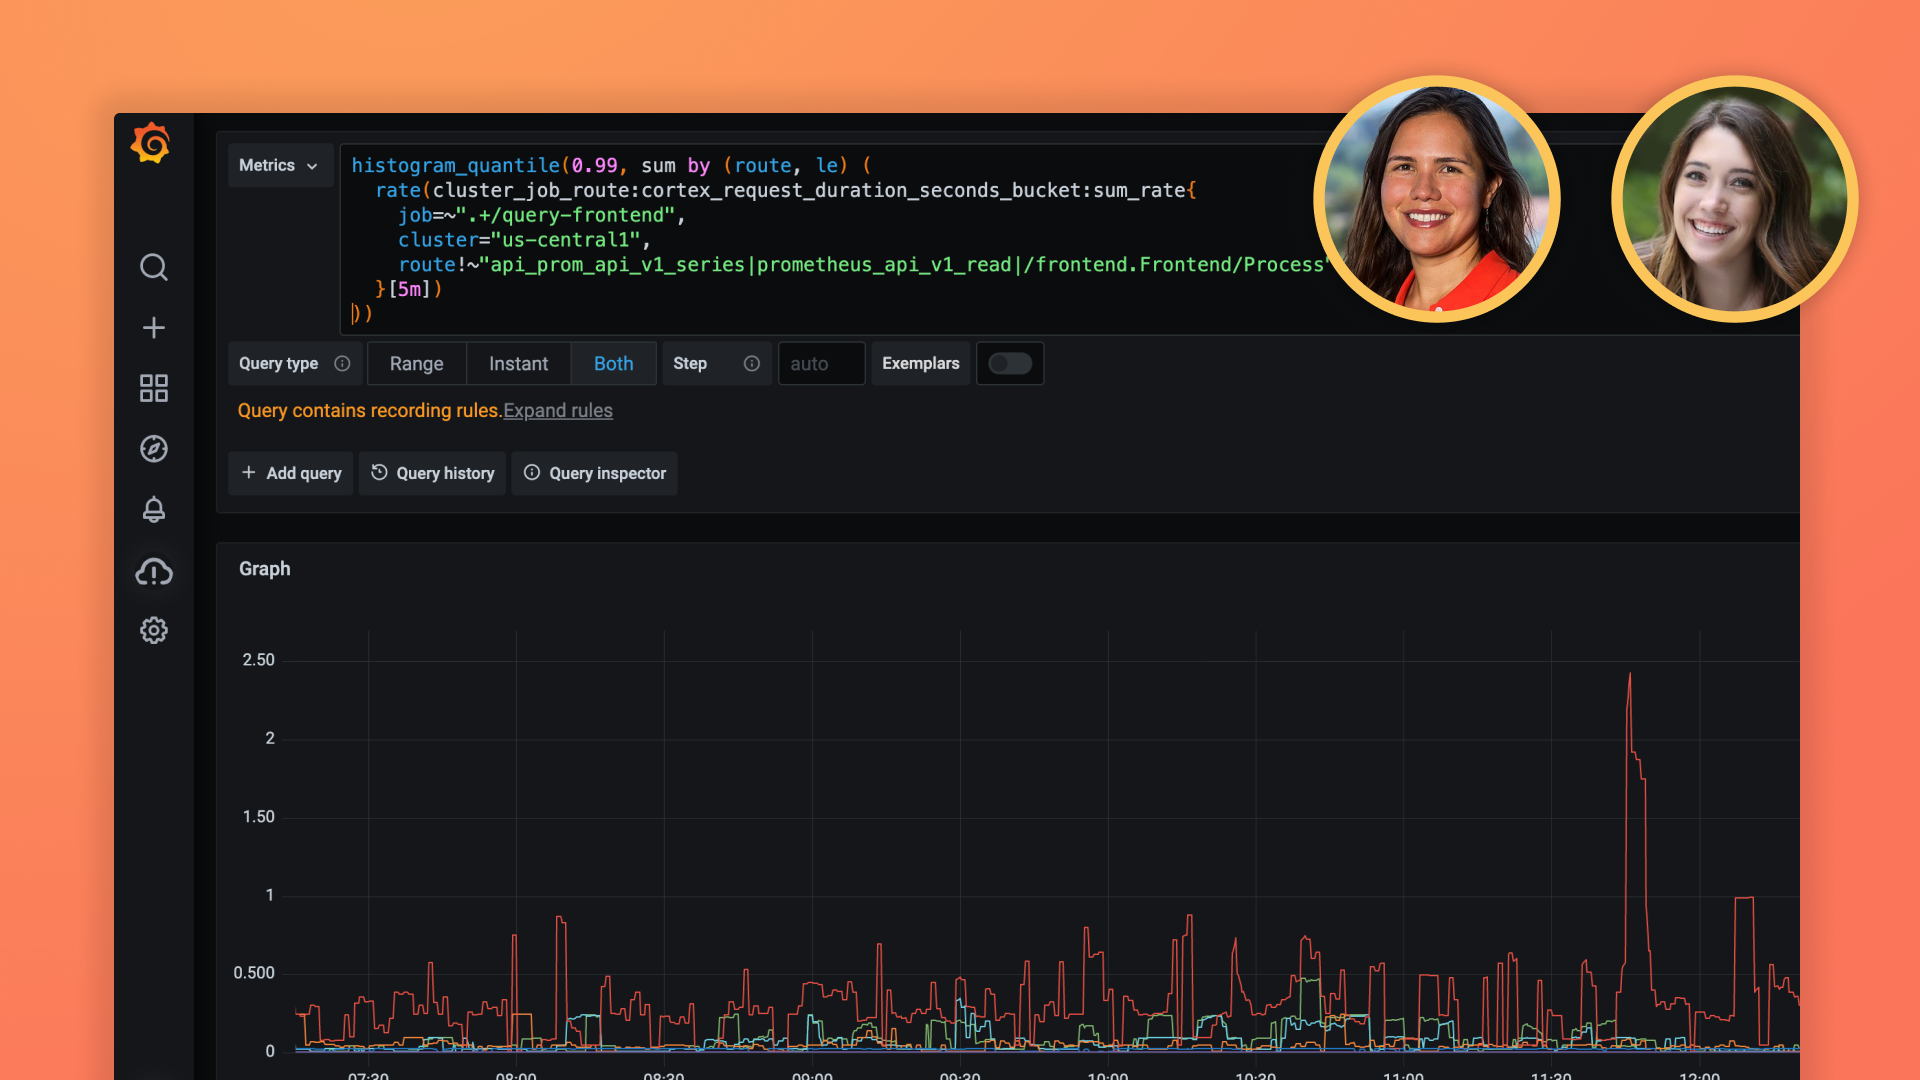
Your guides

Jen Villa
Director of Product
Grafana Labs

Ali Gerrard
Senior Product Marketing Manager
Grafana Labs