This on-demand recording is exclusive to Reliance JIO and Reliance group employees only!
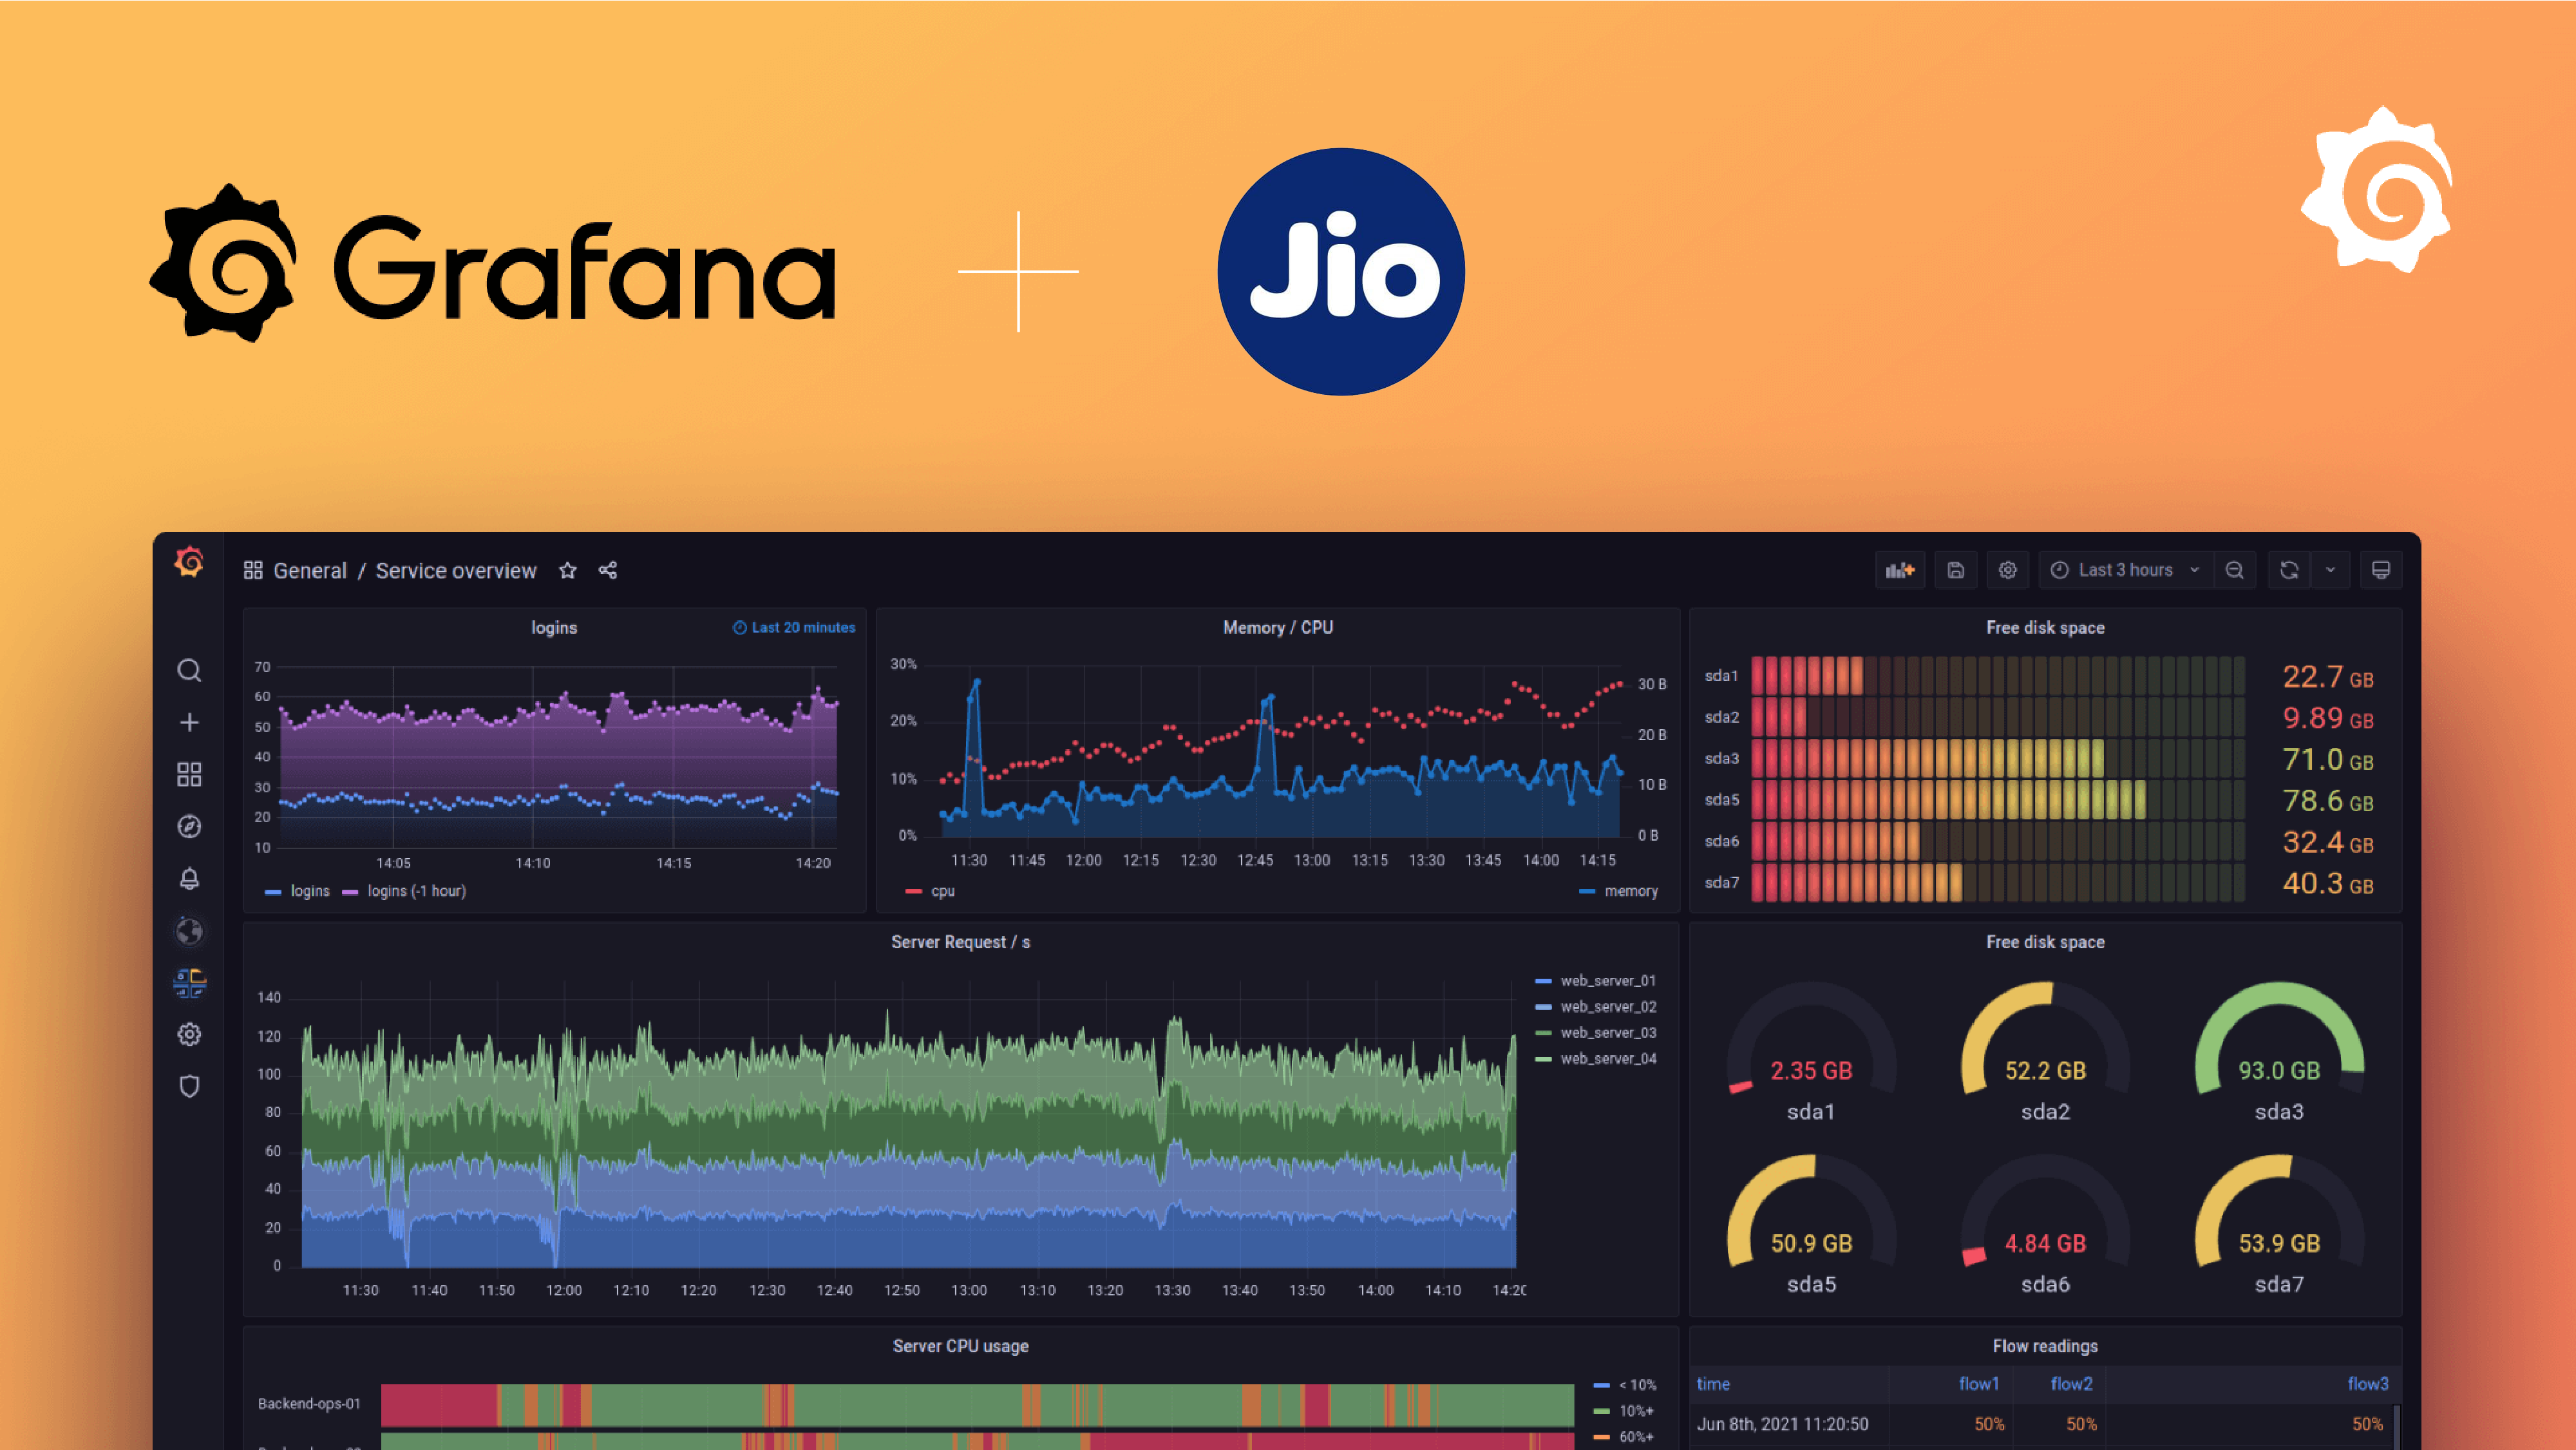
This is an exclusive, highly interactive, virtual technical session created specifically for Reliance JIO recorded live on 22nd March 2022. Our experts will be sharing aspects of Grafana Enterprise, advancements in visualisation, metrics (Prometheus), Grafana 8, Loki, and Tempo. Hear from your Reliance JIO teammates firsthand as they will share their stories and best practices in Grafana.
Who Should Attend
This technical knowledge-transfer session is ideal for all IT teams that manage and interpret logs and data from various sources like Prometheus, Splunk, Elastic, and New Relic, to name a few. This interactive session will be highly beneficial for individuals who are involved in site reliability engineering (SRE), DevOps, application development and management, data pipeline management, and infrastructure integration.
Agenda
Whether you are just getting started with monitoring or you are a Grafana expert, there’s something for you in this tech session that will cover the following topics:
- Reliance JIO + Grafana Labs Welcome and Intro
- Unified Observability with Grafana
- Grafana Usage @ Reliance JIO with Metrics and Logs by Jayesh Sharma of JIO Platform Limited
- Grafana Loki Deep Dive
- Grafana Cloud - Demo of Synthetic Monitoring, Alerts, and MORE
- The Grafana Project Deep Dive (latest functionality of 8.0+, plugins, RBAC, multi-tenancy, and MORE)
- Grafana Usage @ Reliance JIO with Traces by Jayesh Sharma of JIO Platform Limited
- Tempo Distributed Tracing Deep Dive
- Tempo Roadmap
- Ask-Me-Anything and Next Steps
Join the conversation
Join the conversation on Grafana Labs Slack Community for live agenda and event updates! You will receive the Customer Day Slack channel once your registration is confirmed.
Your guides


