What you'll learn
- Connect disparate data from multiple tools to Grafana for a unified ‘first-pane-of-glass’
- Create your first Grafana dashboard
- Correlate observability data - metrics, logs and traces - so you can resolve incidents faster
Unify, correlate, and visualize data with dashboards using Grafana
New to Grafana? Do you have too many monitoring tools and find yourself moving between different tabs or products when troubleshooting?
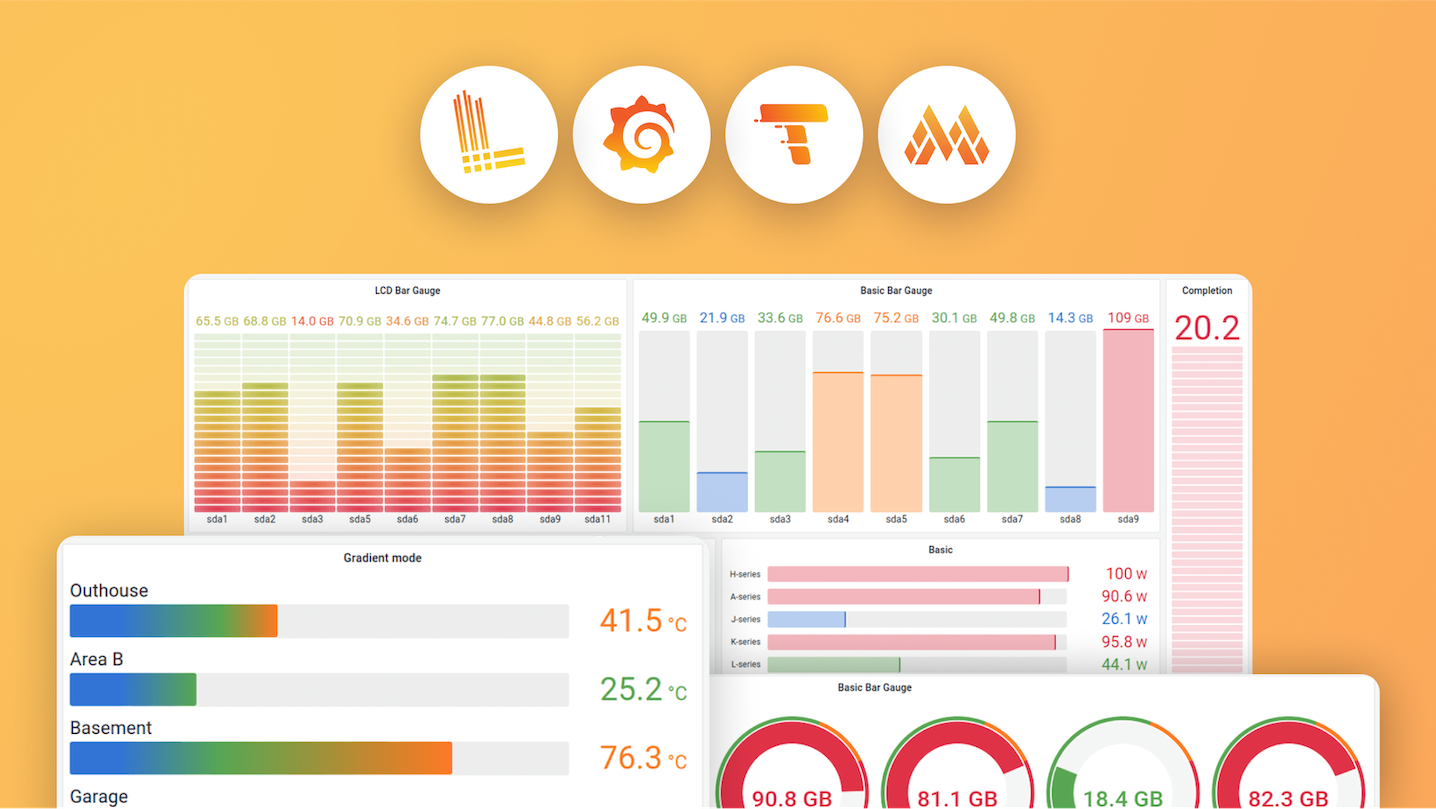
In this webinar, we’ll introduce you to the LGTM stack, Grafana Labs’ opinionated observability stack which includes: Loki-for logs, Grafana - for dashboards and visualization, Tempo - for traces, and Mimir - for metrics. We’ll also give you a sneak peek at what’s new in Grafana 12, the latest major release of your favorite dashboarding tool
We will walk you through how to get started with Grafana, including building your first Grafana dashboard, and how you can connect to a wide range of data sources, regardless of where it resides, to get a unified view of your data in a single dashboard.
From there, we will show you how to set up monitoring for a web service that uses the Grafana Cloud LGTM stack to seamlessly correlate the data for faster troubleshooting.
This webinar requires no previous experience with Grafana.

