Important: This documentation is about an older version. It's relevant only to the release noted, many of the features and functions have been updated or replaced. Please view the current version.
Traces and telemetry
Metrics, logs, traces, and profiles form the pillars of observability. Correlating between the four pillars of observability helps create a holistic view of your application and infrastructure.
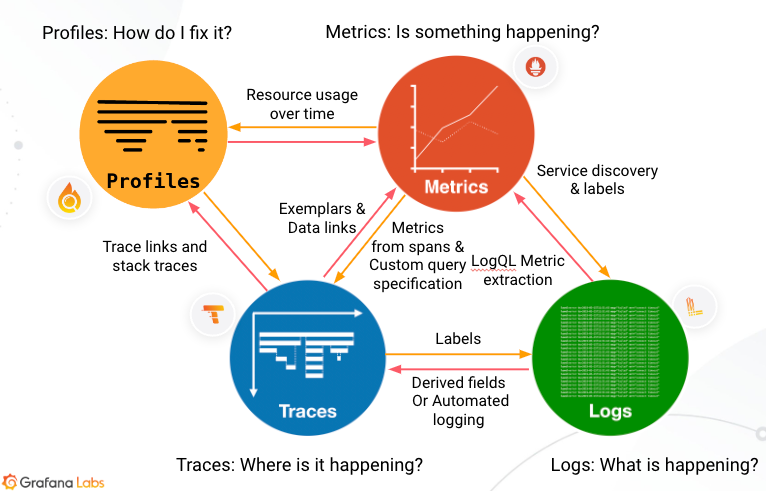
Metrics
Metrics provide a high level picture of the state of a system. Because they are numeric values and therefore can easily be compared against known thresholds, metrics are the foundation of alerts, which constantly run in the background and trigger when a value is outside of an expected range. This is typically the first sign that something is going on and are where discovery first starts. Metrics indicate that something is happening.
Logs
Logs provide an audit trail of activity from a single process that create informational context. Logs act as atomic events, detailing what’s occurring in the services in your application. Whereas metrics are quantitative (numeric) and structured, logs are qualitative (textual) and unstructured or semi-structured. They offer a higher degree of detail, but also at the expense of creating significantly higher data volumes. Logs let you know what’s happening to your application.
Traces
Traces add further to the observability picture by telling you what happens at each step or action in a data pathway. Traces provide the map–-the where–-something is going wrong. A trace provides a graphic representation of how long each step in the data flow pathway (for example, HTTP request, database lookup, call to a third party service) takes to complete. It can show where new requests are initiated and finished, as well as how your system responds. This data helps you locate problem areas and assess their impact, often in places you never would have anticipated or found without this ability to trace the request flow.
Profiles
Profiles help you understand how your applications utilize compute resources such as CPU time and memory. This allows you to identify specific lines of code or functions that can be optimized to improve application performance and efficiency.
Why traces?
Metrics in themselves aren’t sufficient to find the root cause and solve complex issues. The same can be said for logs, which can contain a significant amount of information but lack the context of the interactions and dependencies between the different components of your complex environment. Each pillar of observability (metrics, logs, traces, profiles) has its own unique strength when it comes to root causing issues. To get the most value of your observability strategy, you need to be able to correlate them.
Traces have the unique ability to show relationships between services. They allow you to identify which services are upstream from your service, which is helpful when you want to understand which services might be negatively impacted by problems in your service. They also allow you to identify which services are downstream from your service; this is valuable since your application relies on their downstream services, and problems with those services may be the cause of elevated errors or latency being reported by your service. For example, you can directly see the failing database and all impacted failing edge endpoints.
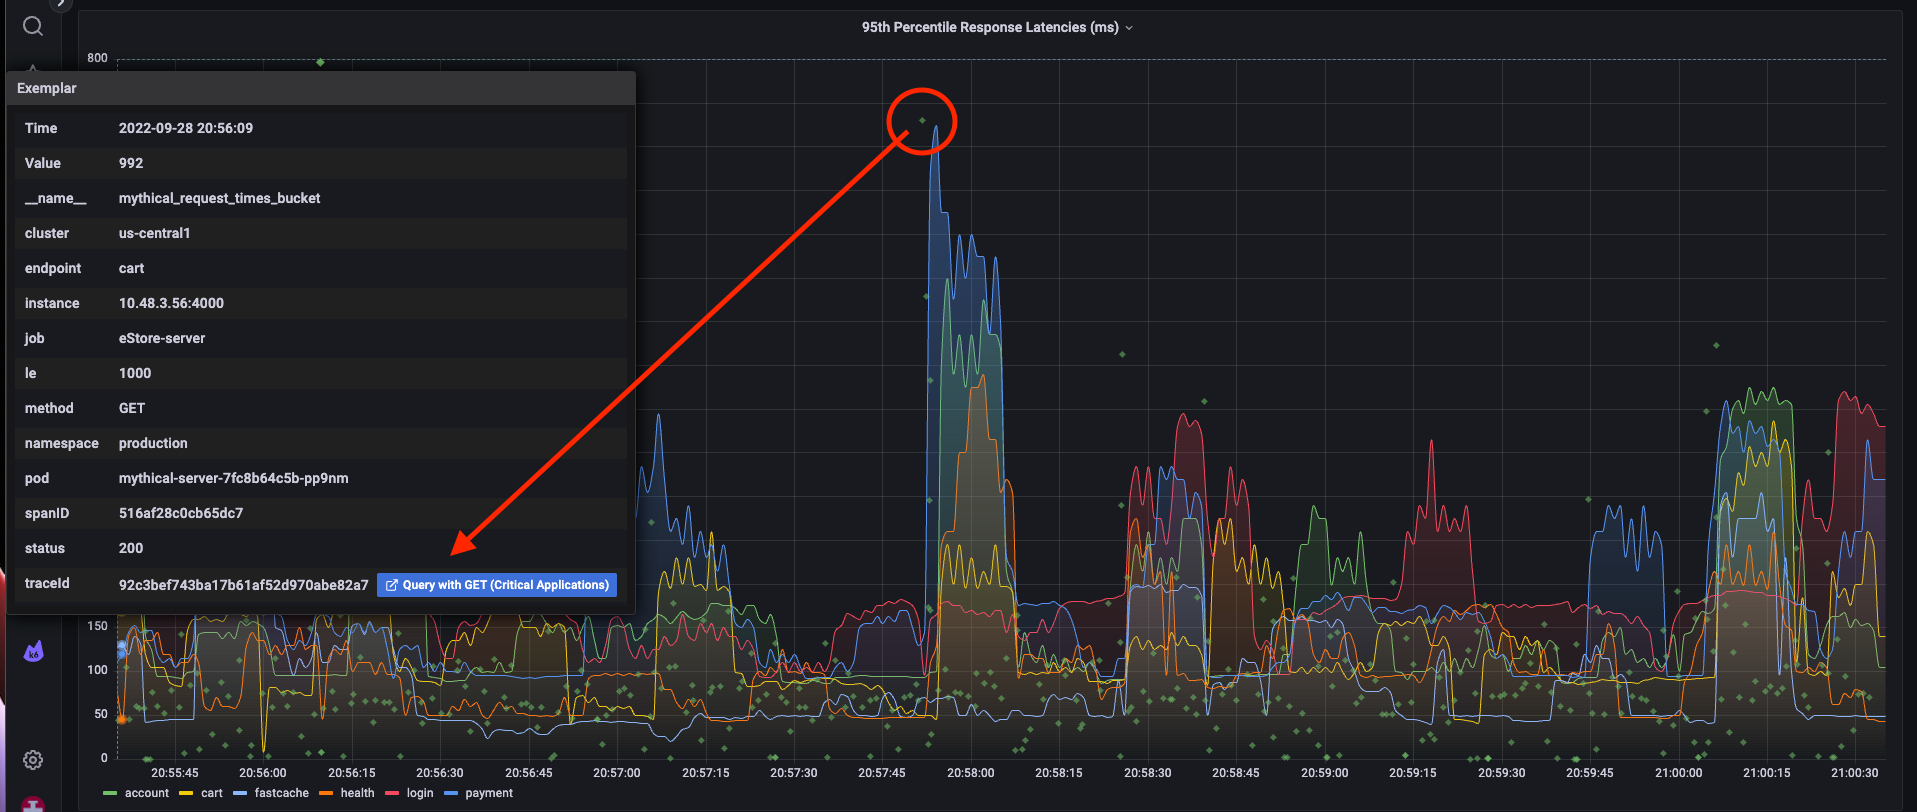
Using traces and exemplars, you can go from a metric data point and get to an associated trace.
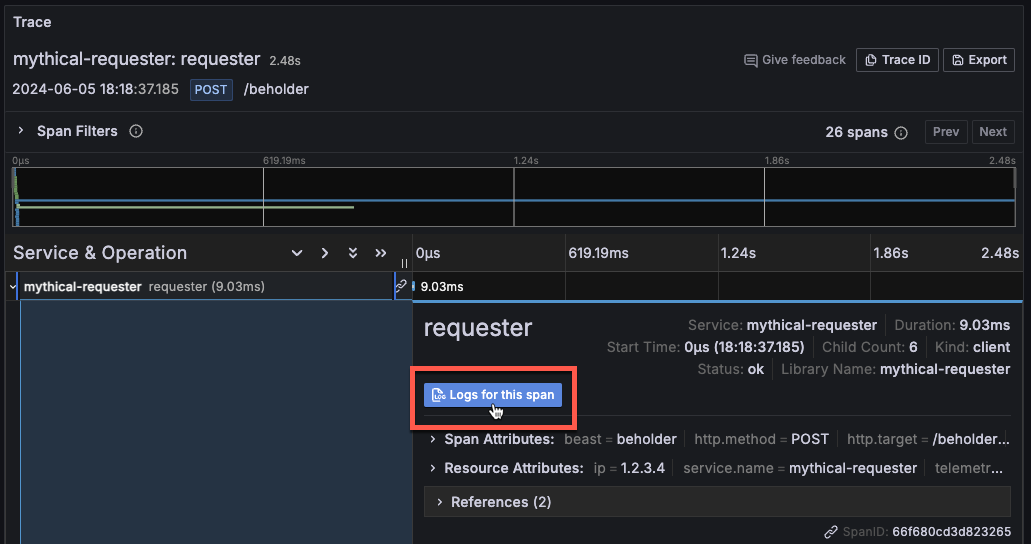
Or from traces to logs:
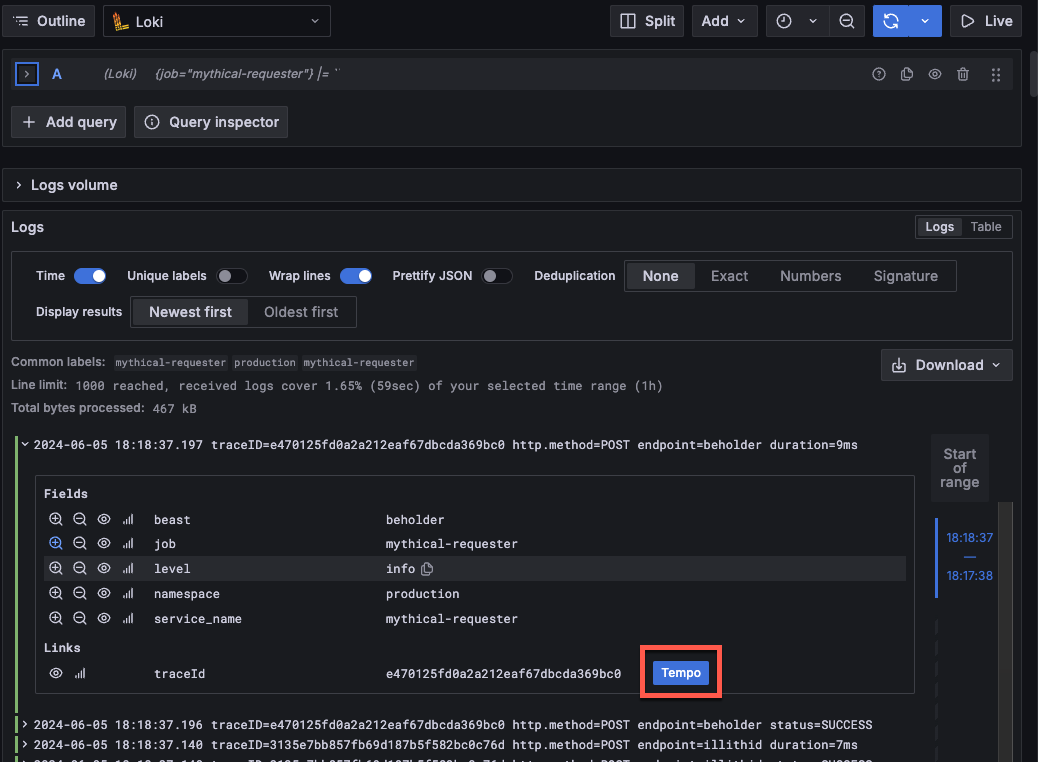
And vice versa, from logs to traces.