Important: This documentation is about an older version. It's relevant only to the release noted, many of the features and functions have been updated or replaced. Please view the current version.
Diagnose errors with traces
Traces allow you to quickly diagnose errors in your application, ensuring that you can perform Root Cause Analysis (RCA) on request failures. Trace visualizations help you determine the spans in which errors occur, along with the context behind those errors, leading to a lower mean time to repair (MTTR).
Meet Handy Site Corp
Handy Site Corp, a fake website company, runs an ecommerce application that includes user authentication, a product catalog, order management, payment processing, and other services.
Handy Site’s operations team receives several alerts for their error SLO for monitored endpoints in their services. Using their Grafana dashboards, they notice that there are several issues. The dashboard provides the percentages of errors:
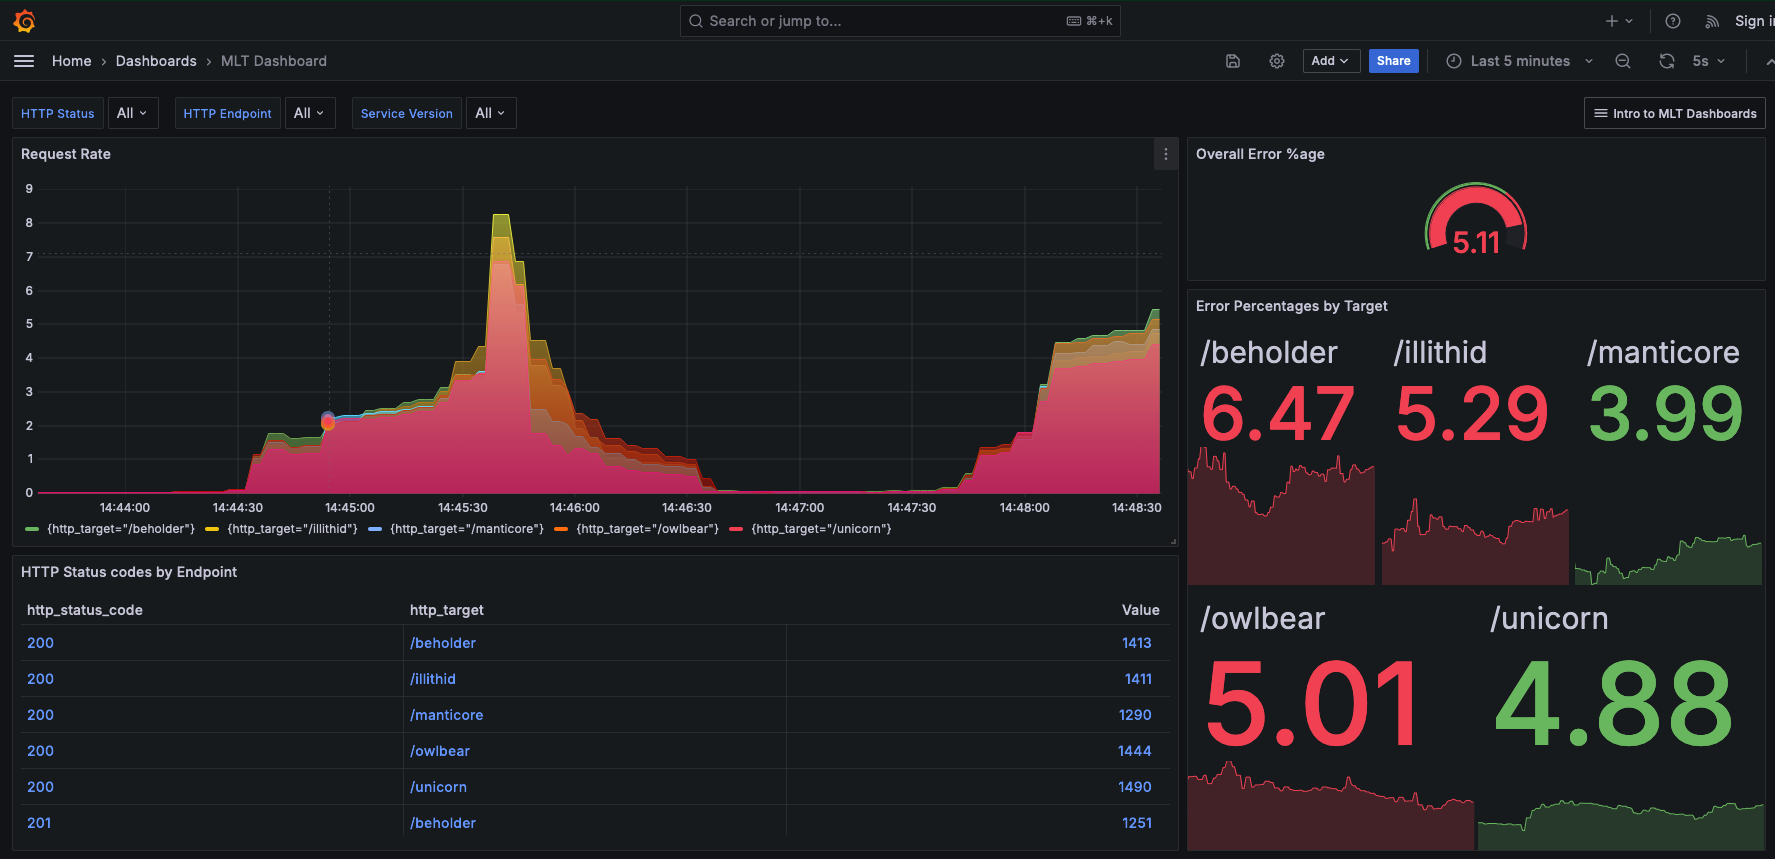
More than 5% of the requests from users are resulting in an error across several endpoints, such as /beholder, /owlbear, and /illithid, which causes a degradation in performance and usability.
It’s imperative for the operations team at Handy Site to quickly troubleshoot the issue. The elevated error rates indicate that the Handy Site is unable to provide valid responses to their users’ requests, which in addition to threatening the operation team’s SLO error budget also affects profitability overall for Handy Site.
Use TraceQL to query data
Tempo has a traces-first query language, TraceQL, that provides a unique toolset for selecting and searching tracing data. TraceQL can match traces based on span and resource attributes, duration, and ancestor<>descendant relationships. It also can compute aggregate statistics (e.g., rate) over a set of spans.
Handy Site’s services and applications are instrumented for tracing, so they can use TraceQL as a debugging tool. Using three TraceQL queries, the team identifies and validates the root cause of the issue.
Find HTTP errors
The top-level service, mythical-requester receives requests and returns responses to users. When it receives a request, it calls numerous downstream services whose responses it relies on in order to send a response to the user request.
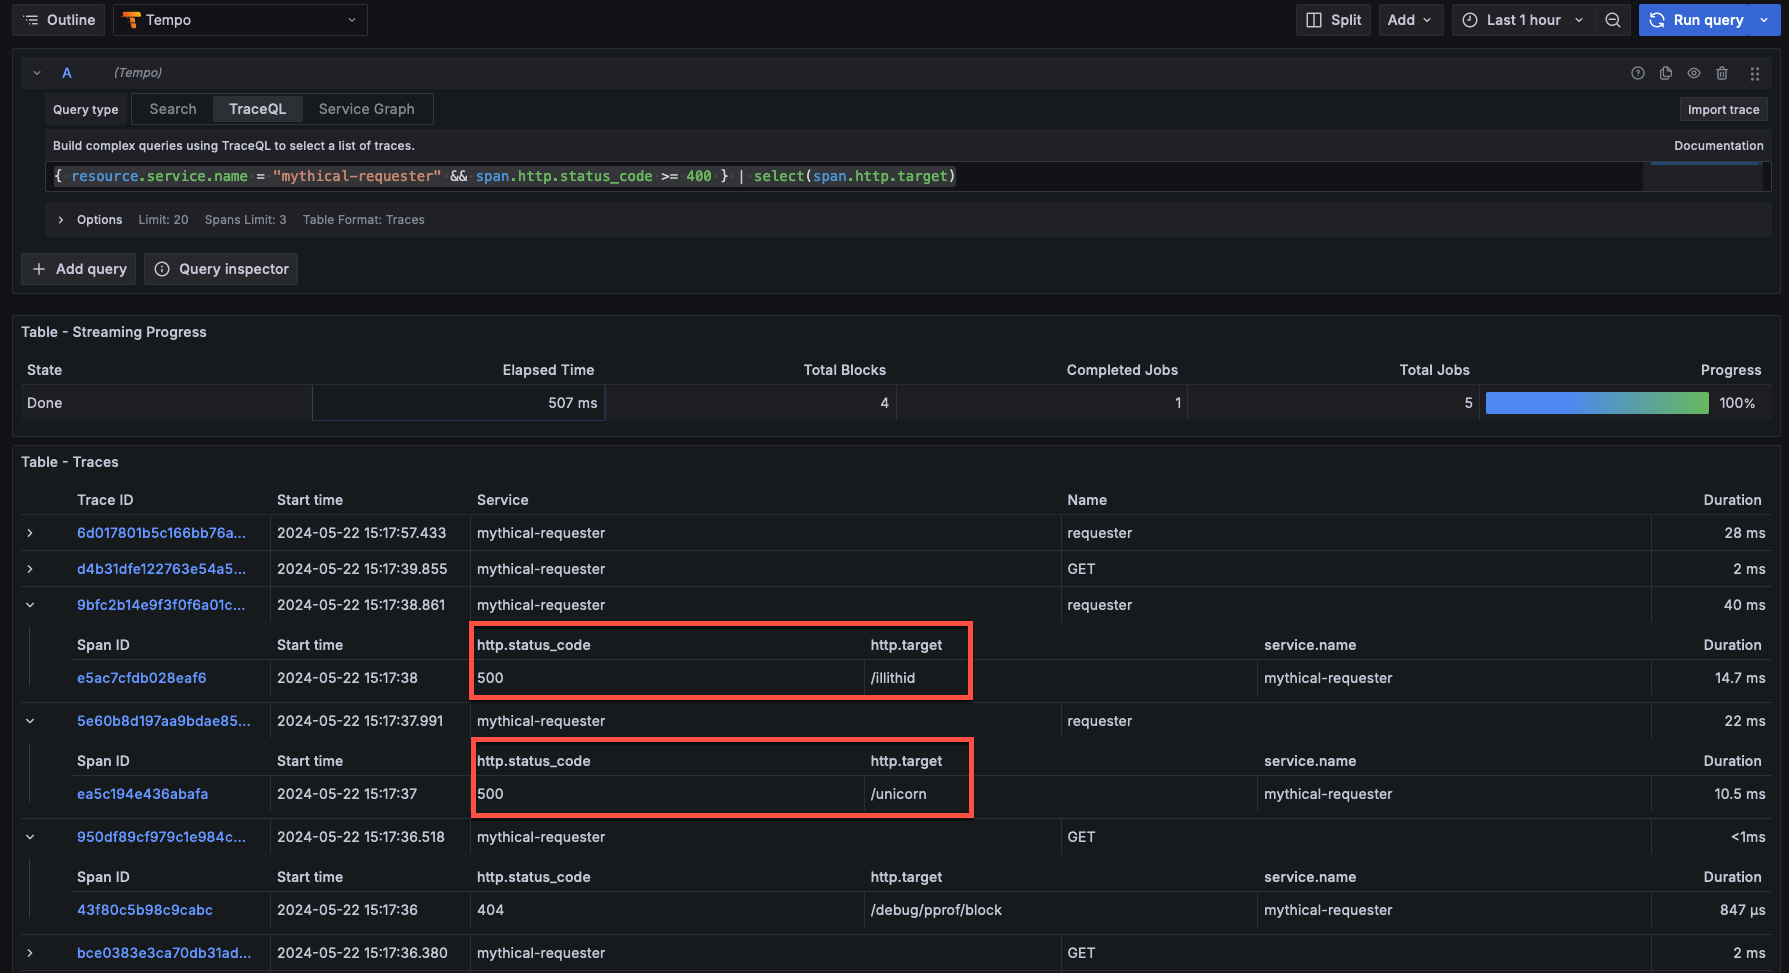
Using Grafana Explore, the operations team starts with a simple TraceQL query to find all traces from this top-level service, where an HTTP response code sent to a user is 400 or above. Status codes in this range include Forbidden, Not found, Unauthorized, and other client and server errors.
{ resource.service.name = "mythical-requester" && span.http.status_code >= 400 } | select(span.http.target)The addition of the select statement to this query (after the |) ensures that the query response includes not only the set of matched spans, but also the http.target attribute (i.e. the endpoints for the SaaS service) for each of those spans.
Pinpoint the error
Looking at the set of returned spans, the most concerning ones are those with the HTTP 500 status code. Those are internal server errors.
The team decides to use structural operators to follow an error chain from the top-level mythical-requester service to any descendant spans that also have an error status.
Descendant spans can be any span that’s descended from the parent span, such as a child or a further child at any depth.
Using this query, the team can pinpoint the downstream service that might be causing the issue. The query below says “Find me spans where status = error that that are descendants of spans from the mythical-requester service that have status code 500.”
{ resource.service.name = "mythical-requester" && span.http.status_code = 500 } >> { status = error }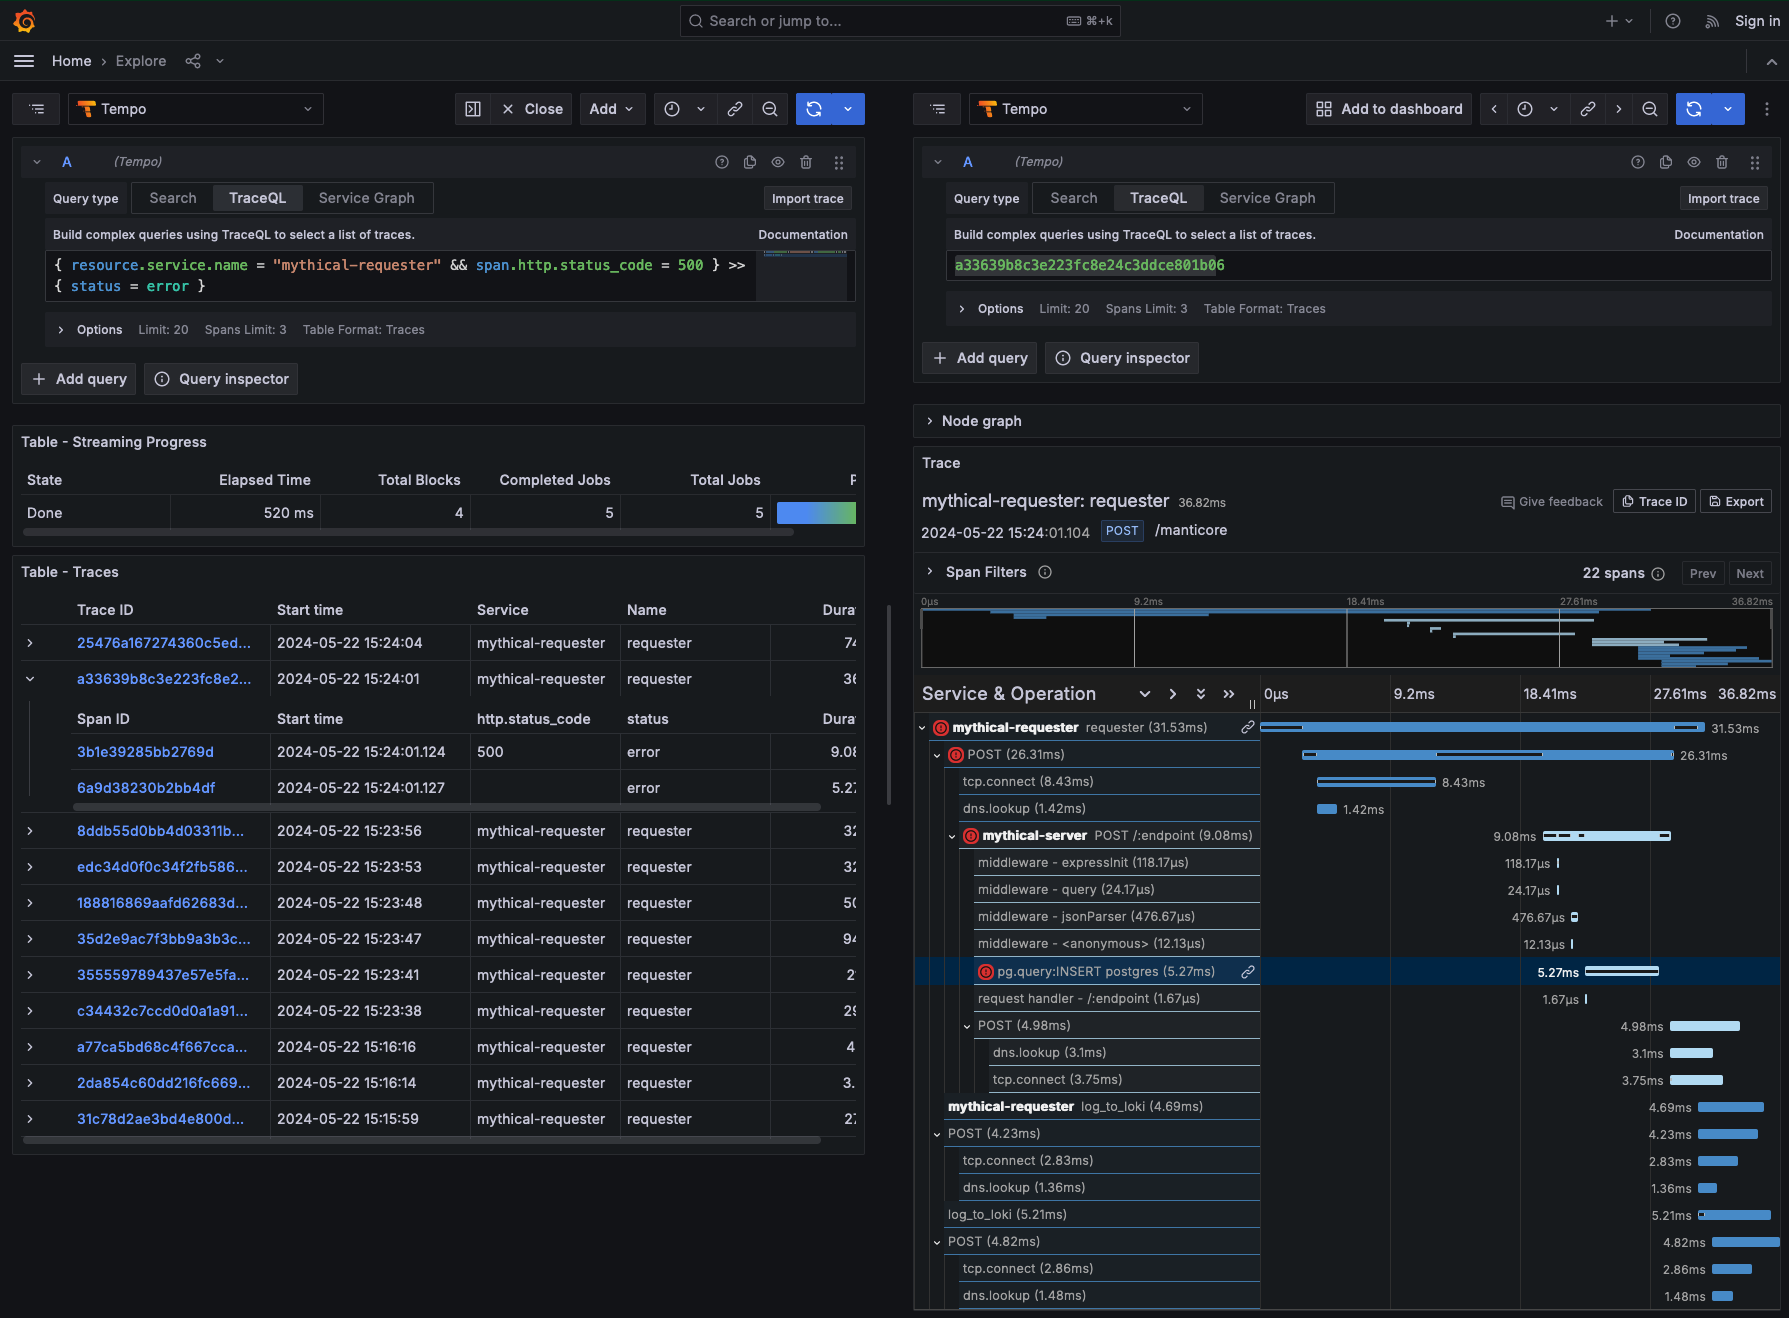
Expanding the erroring span that is a descendant of the span for the mythical-server service shows the team that there is a problem with the data being inserted into the database.
Specifically, the service is passing a null value for a column in a database table where null values are invalid.

Verify root cause
After identifying the specific cause of this internal server error,
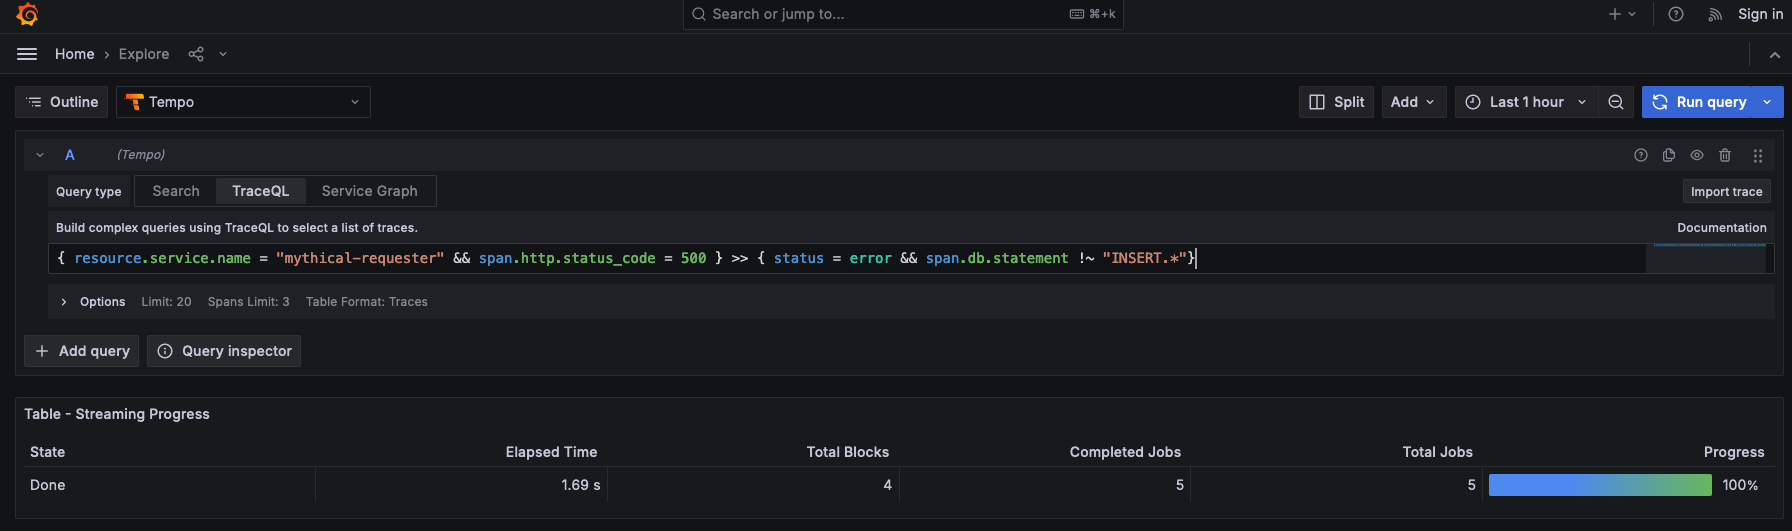
the team wants to know if there are errors in any database operations other than the null INSERT error found above.
Their updated query uses a negated regular expression to find any spans where the database statement either doesn’t exist, or doesn’t start with an INSERT clause.
This should expose any other issues causing an internal server error and filter out the class of issues that they already diagnosed.
{ resource.service.name = "mythical-requester" && span.http.status_code = 500 } >> { status = error && span.db.statement !~ "INSERT.*" }This query yields no results, suggesting that the root cause of the issues the operations team are seeing is exclusively due to the failing database INSERT statement.
At this point, they can roll back to a known working version of the service, or deploy a fix to ensure that null data being passed to the service is rejected appropriately.
Once that is complete, the issue can be marked resolved and the Handy team’s error rate SLI should return back to acceptable levels.