Important: This documentation is about an older version. It's relevant only to the release noted, many of the features and functions have been updated or replaced. Please view the current version.
Identify bottlenecks and establish SLOs
Traces give a window into an application’s performance, and the insights that go along with that. Using traces, you can discover bottlenecks and potential optimizations that can decrease latency and response times and increase application throughput.
Meet Handy Site Corp
Handy Site Corp, a fake website company, runs an ecommerce application that includes user authentication, a product catalog, order management, payment processing, and other services.
Define realistic SLOs
Handy Site’s engineers start by establishing service level objectives (SLOs) around latency ensure that customers have a good experience when trying to complete the checkout process. To do this, they use metrics generated from their span data.
Their service level objective should be a realistic target based on previous history during times of normal operation. Once they’ve agreed upon their service level objective, they will set up alerts to warn them when they are at risk of failing to meet that objective.
Utilize span metrics to define your SLO and SLI
After evaluating options, they decide to use span metrics as a service level indicator (SLI) to measure SLO compliance.
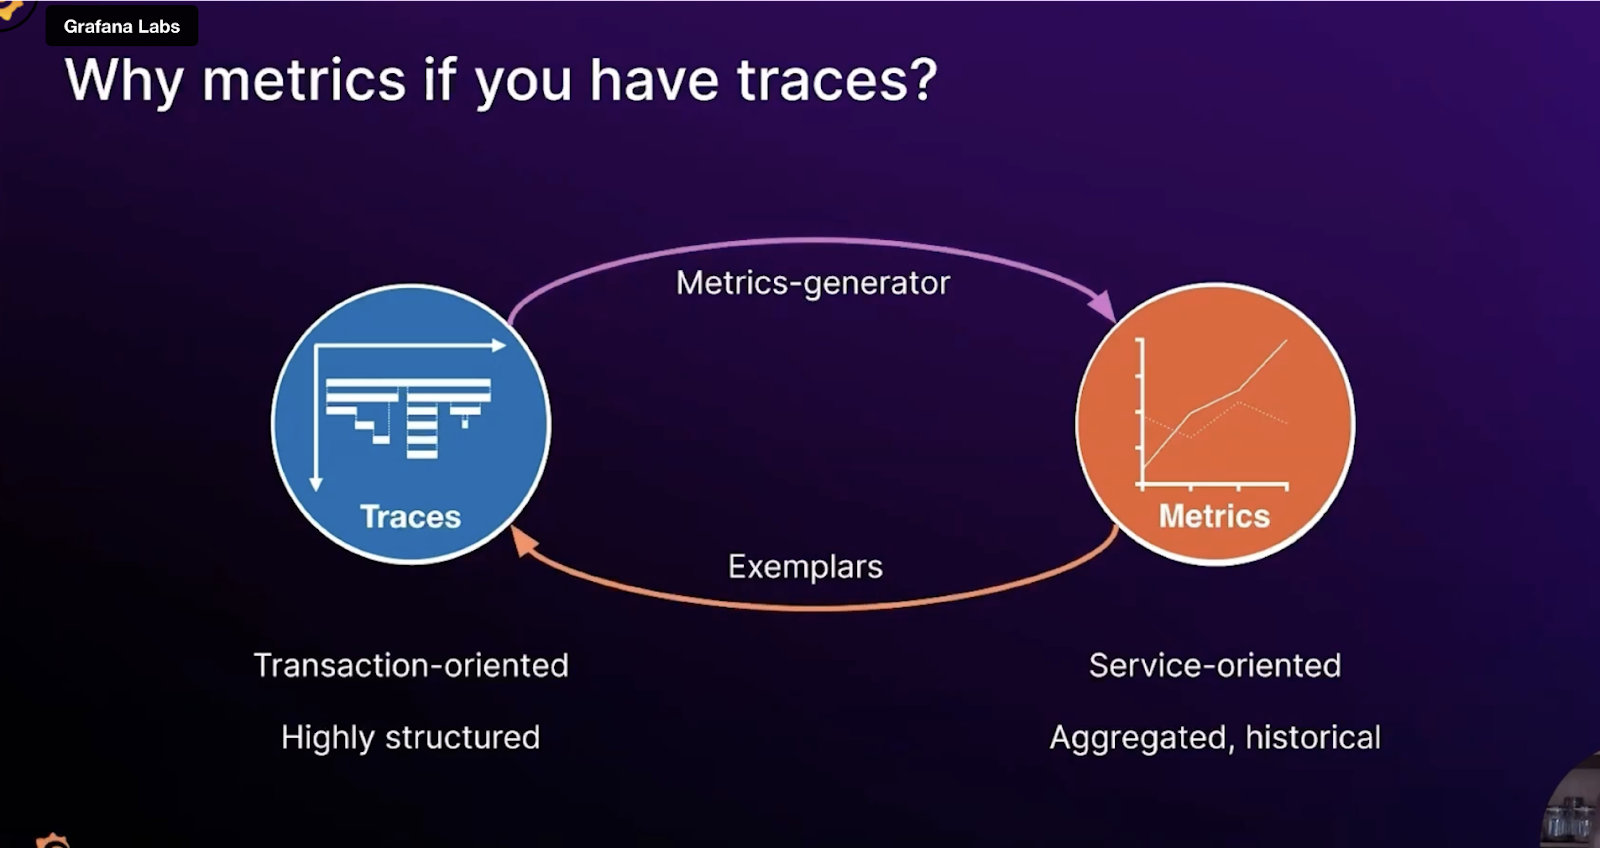
Tempo can generate metrics using the metrics-generator component. These metrics are created based on spans from incoming traces and demonstrate immediate usefulness with respect to application flow and overview. This includes rate, error, and duration (RED) metrics.
Span metrics also make it easy to use exemplars. An exemplar serves as a detailed example of one of the observations aggregated into a metric. An exemplar contains the observed value together with an optional timestamp and arbitrary trace IDs, which are typically used to reference a trace. Since traces and metrics co-exist in the metrics-generator, exemplars can be automatically added to those metrics, allowing you to quickly jump from a metric showing aggregate latency over time into an individual trace that represents a low, medium, or high latency request. Similarly, you can quickly jump from a metric showing error rate over time into an individual erroring trace.
Monitor latency
Handy Site decides they’re most interested in monitoring the latency of requests processed by their checkout service and want to set an objective that 99.5% of requests in a given month should complete within 2 seconds.
To define a service level indicator (SLI) that they can use to track their progress against their objective, they use the traces_spanmetrics_latency metric with the proper label selectors, such as service name = checkoutservice.
The metrics-generator adds a default set of labels to the metrics it generates, including span_kind and status_code. However, if they were interested in calculating checkout service latency per endpoint or per version of the software, they could change the configuration of the Tempo metrics-generator to add these custom dimensions as labels to their spanmetrics.
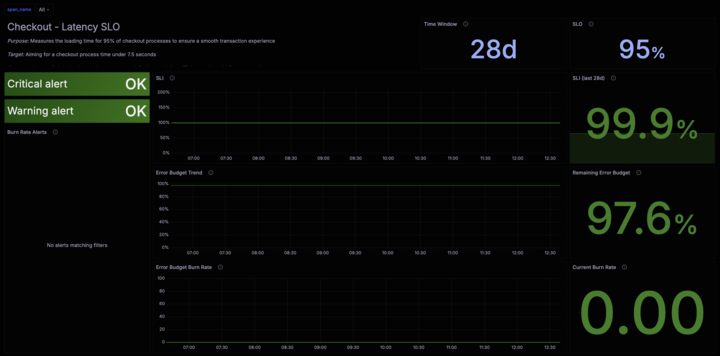
With all of this in place, Handy Site now opens the Grafana SLO application and follows the setup flow to establish an SLI for their checkout service around the traces_spanmetrics_latency metric..
They can now be alerted to degradations in service quality that directly impact their end user experience. SLO-based alerting also ensures that they don’t suffer from noisy alerts. Alerts are only triggered when the value of the SLI is such that the team is in danger of missing their SLO.