This is documentation for the next version of Grafana Tempo documentation. For the latest stable release, go to the latest version.
Validate your local Tempo deployment
Once you’ve set up Grafana Tempo, the next step is to test your deployment to ensure that traces are emitted and collected correctly. This procedure uses a Docker Compose example in the Tempo repository.
Verify your cluster is working
To verify that Tempo is working, run the following command:
systemctl is-active tempoYou should see the status active returned. If you don’t, check that the configuration file is correct, and then restart the service.
You can also use journalctl -u tempo to view the logs for Tempo to determine if there are any obvious reasons for failure to start.
Verify that your storage bucket has received data by signing in to your storage provider and determining that a file has been written to storage.
It should be called tempo_cluster_seed.json.
Test your installation
Once Tempo is running, you can use the K6 with Traces Docker example to verify that trace data is sent to Tempo. This procedure sets up a sample data source in Grafana to read from Tempo.
Backend storage configuration
The Tempo examples running with docker-compose all include a version of Tempo and a storage backend like S3 and GCS.
Because Tempo is installed with a backend storage configured, you need to change the docker-compose.yaml file to remove Tempo and instead point trace storage to the installed version.
These steps are included in this section.
Network configuration
Docker compose uses an internal networking bridge to connect all of the defined services. Because the Tempo instance is running as a service on the local machine host, you need the resolvable IP address of the local machine so the docker containers can use the Tempo service. You can find the host IP address of your Linux machine using a command such as ip addr show.
Steps
Clone the Tempo repository:
git clone https://github.com/grafana/tempo.gitGo into the examples directory:
cd tempo/example/docker-compose/localEdit the file
docker-compose.yaml, and remove thetemposervice and all its properties, so that the first service defined isk6-tracing. The start of yourdocker-compose.yamlshould look like this:version: "3" services: k6-tracing:Edit the
k6-tracingservice, and change the value ofENDPOINTto the local IP address of the machine running Tempo and docker compose, eg.10.128.0.104:4317. This is the OTLP gRPC port:environment: - ENDPOINT=10.128.0.104:4317This ensures that the traces sent from the example application go to the locally running Tempo service on the Linux machine.
Edit the
k6-tracingservice and remove the dependency on Tempo by deleting the following lines:depends_on: tempoSave the
docker-compose.yamlfile and exit your editor.Edit the default Grafana data source for Tempo that is included in the examples. Edit the file located at
tempo/example/shared/grafana-datasources.yaml, and change theurlfield of theTempodata source to point to the local IP address of the machine running the Tempo service instead (eg.url: http://10.128.0.104:3200). The Tempo data source section should resemble this:- name: Tempo type: tempo access: proxy orgId: 1 url: http://10.128.0.104:3200Save the file and exit your editor.
Edit the Prometheus configuration file so it uses the Tempo service as a scrape target. Change the target to the local Linux host IP address. Edit the
tempo/example/shared/prometheus.yamlfile, and alter thetempojob to replacetempo:3200with the Linux machine host IP address.- job_name: 'tempo' static_configs: - targets: [ '10.128.0.104:3200' ]Save the file and exit your editor.**
Start the three services that are defined in the docker-compose file:
docker compose up -dVerify that the services are running using
docker compose ps. You should see something like:NAME IMAGE COMMAND SERVICE CREATED STATUS PORTS local-grafana-1 grafana/grafana:9.3.2 "/run.sh" grafana 2 minutes ago Up 3 seconds 0.0.0.0:3000->3000/tcp, :::3000->3000/tcp local-k6-tracing-1 ghcr.io/grafana/xk6-client-tracing:v0.0.9 "/k6-tracing run /ex…" k6-tracing 2 minutes ago Up 2 seconds local-prometheus-1 prom/prometheus:latest "/bin/prometheus --c…" prometheus 2 minutes ago Up 2 seconds 0.0.0.0:9090->9090/tcp, :::9090->9090/tcpGrafana is running on port 3000, Prometheus is running on port 9090. Both should be bound to the host machine.
As part of the docker compose manifest, Grafana is now running on your Linux machine, reachable on port 3000. Point your web browser to the Linux machine on port 3000. You might need to port forward the local port if you’re doing this remotely, for example, via SSH forwarding.
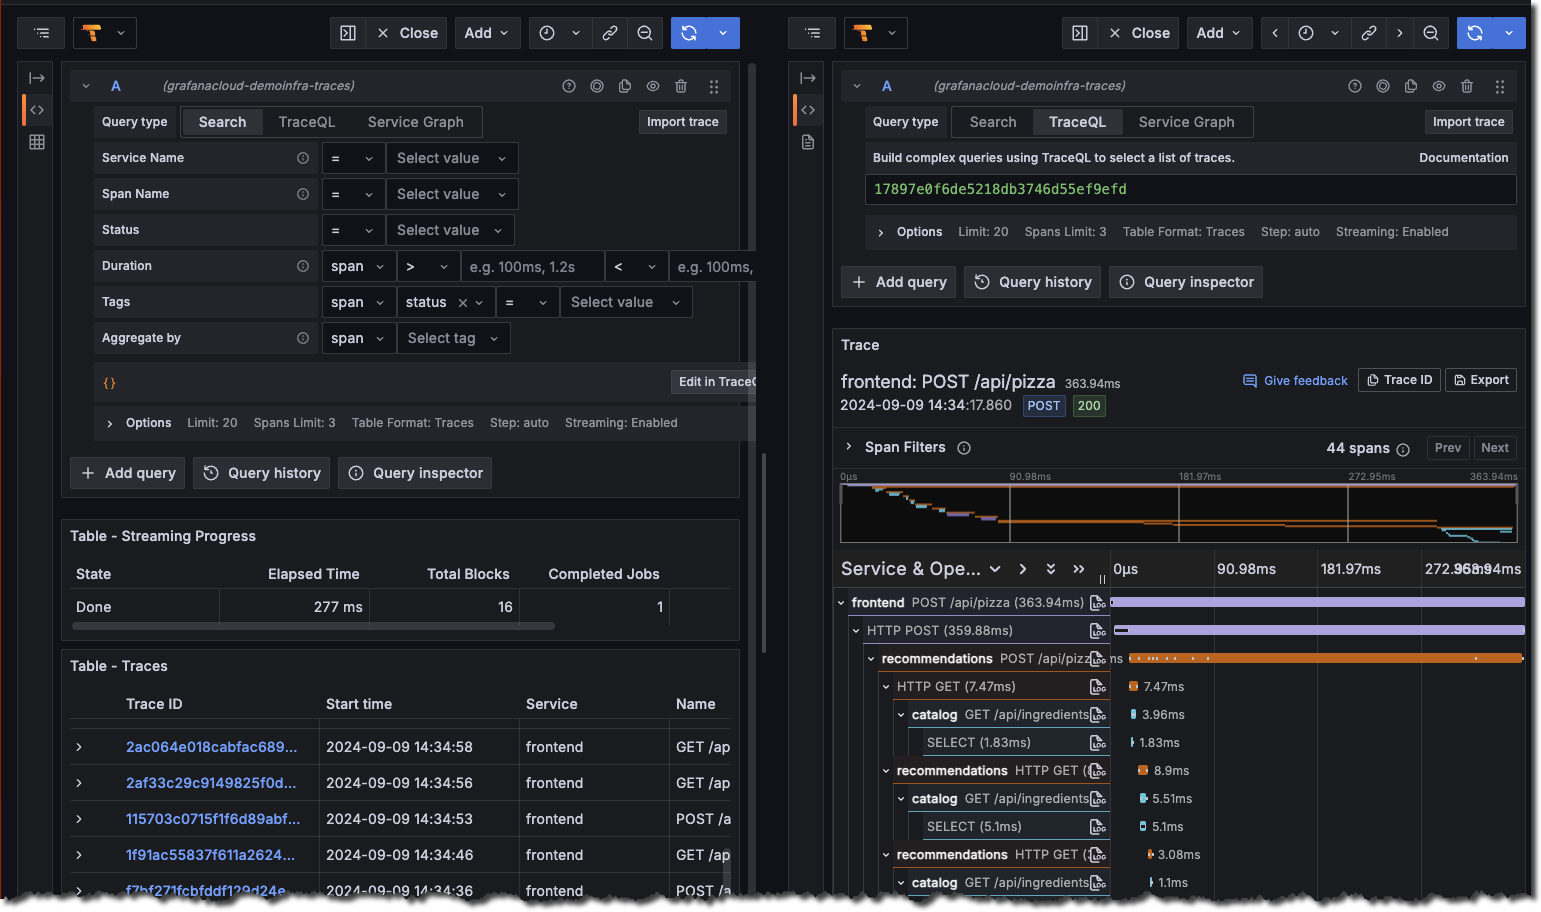
Once logged in, navigate to the Explore page, select the Tempo data source and select the Search tab. Select Run query to list the recent traces stored in Tempo. Select one to view the trace diagram:
![Use the query builder to explore tracing data in Grafana]()
Alter the Tempo configuration to point to the instance of Prometheus running in docker compose. To do so, edit the configuration at
/etc/tempo/config.yamland change thestorageblock under themetrics_generatorsection so that the remote write URL ishttp://localhost:9090. The configuration section should look like this:storage: path: /var/tempo/generator/wal remote_write: - url: http://localhost:9090/api/v1/write send_exemplars: trueSave the file and exit the editor.
Finally, restart the Tempo service by running:
sudo systemctl restart tempoA couple of minutes after Tempo has successfully restarted, select the Service graph tab for the Tempo data source in the Explore page. Select Run query to view a service graph, generated by Tempo’s metrics-generator.
![Service graph sample]()