This is documentation for the next version of Grafana Tempo documentation. For the latest stable release, go to the latest version.
About instrumentation
Instrumentation is the act of modifying the source code of a service to emit span information tied to a common trace ID. Traces themselves are a metaobject, comprised of nothing but spans that hold the same ID.

Instrumentation methods
To add instrumentation, the code for a service uses a Software Development Kit (SDK) which supplies language-specific libraries that allow the:
- Creation of a new trace, starting with a new root span.
- Addition of new spans, that are siblings of children of pre-existing spans.
- Addition of span attributes to add contextual information to each span, as well as span links and events.
- Closure of spans when a unit of work is complete.
Adding code to carry out these operations is known as manual instrumentation, as it requires manual intervention by an engineer to write code to deal with traces, as well as to determine where in the code traces/spans should start, the attributes and other data that should be attached to spans, and where traces/spans should end.
There is an alternative/companion to manual instrumentation, auto-instrumentation. Auto-instrumentation is the act of allowing a tracing SDK to determine where traces/spans should start, what information should be added to spans, and where traces/spans should stop. Essentially, manual instrumentation is pre-packaged for a large number of popular frameworks and libraries which are used inside a service’s code, and it’s these libraries/frameworks that are actually emitting spans for a trace.
Zero-code instrumentation uses eBPF technology to instrument applications without code changes. Grafana Beyla is an example of a zero-code instrumentation tool.
Hybrid instrumentation combines auto and manual instrumentation, using automatic for most code and manual for custom tracing logic.
These libraries usually include those dealing with networking, so for example a request coming into a service might be via an auto-instrumented HTTP library, which would then start a trace until it sent a response back via HTTP to the requester. Along the course of the request, the service might use other libraries that process data, and if they’re also auto-instrumented then new spans are generated for the trace that include suitable attributes.
This produces a trace that can be very useful, but ultimately doesn’t include any spans that are specific to service code that isn’t executing library commands. Because of this, the best traced services are usually those that include a mixture of auto and manual instrumentation.
Traces usually exist in relation to a request made to an application, and spans are generated when new units of work occur whilst processing that request. A trace usually ends when a response to the request is sent.
The OpenTelemetry SDK is Grafana’s recommended solution for instrumenting, and it supports a myriad of modern languages, detailed in the linked page.
Additionally, instrumentation SDKs usually emit span information to a local receiver/collector. Examples of these are Grafana Alloy and the OpenTelemetry Collector. These receivers can then carry out additional processing on the traces (such as tail sampling, span batching, process filtering, etc.) to modify a trace and its spans before they’re sent to a final destination, usually a tracing backend like Grafana Tempo.
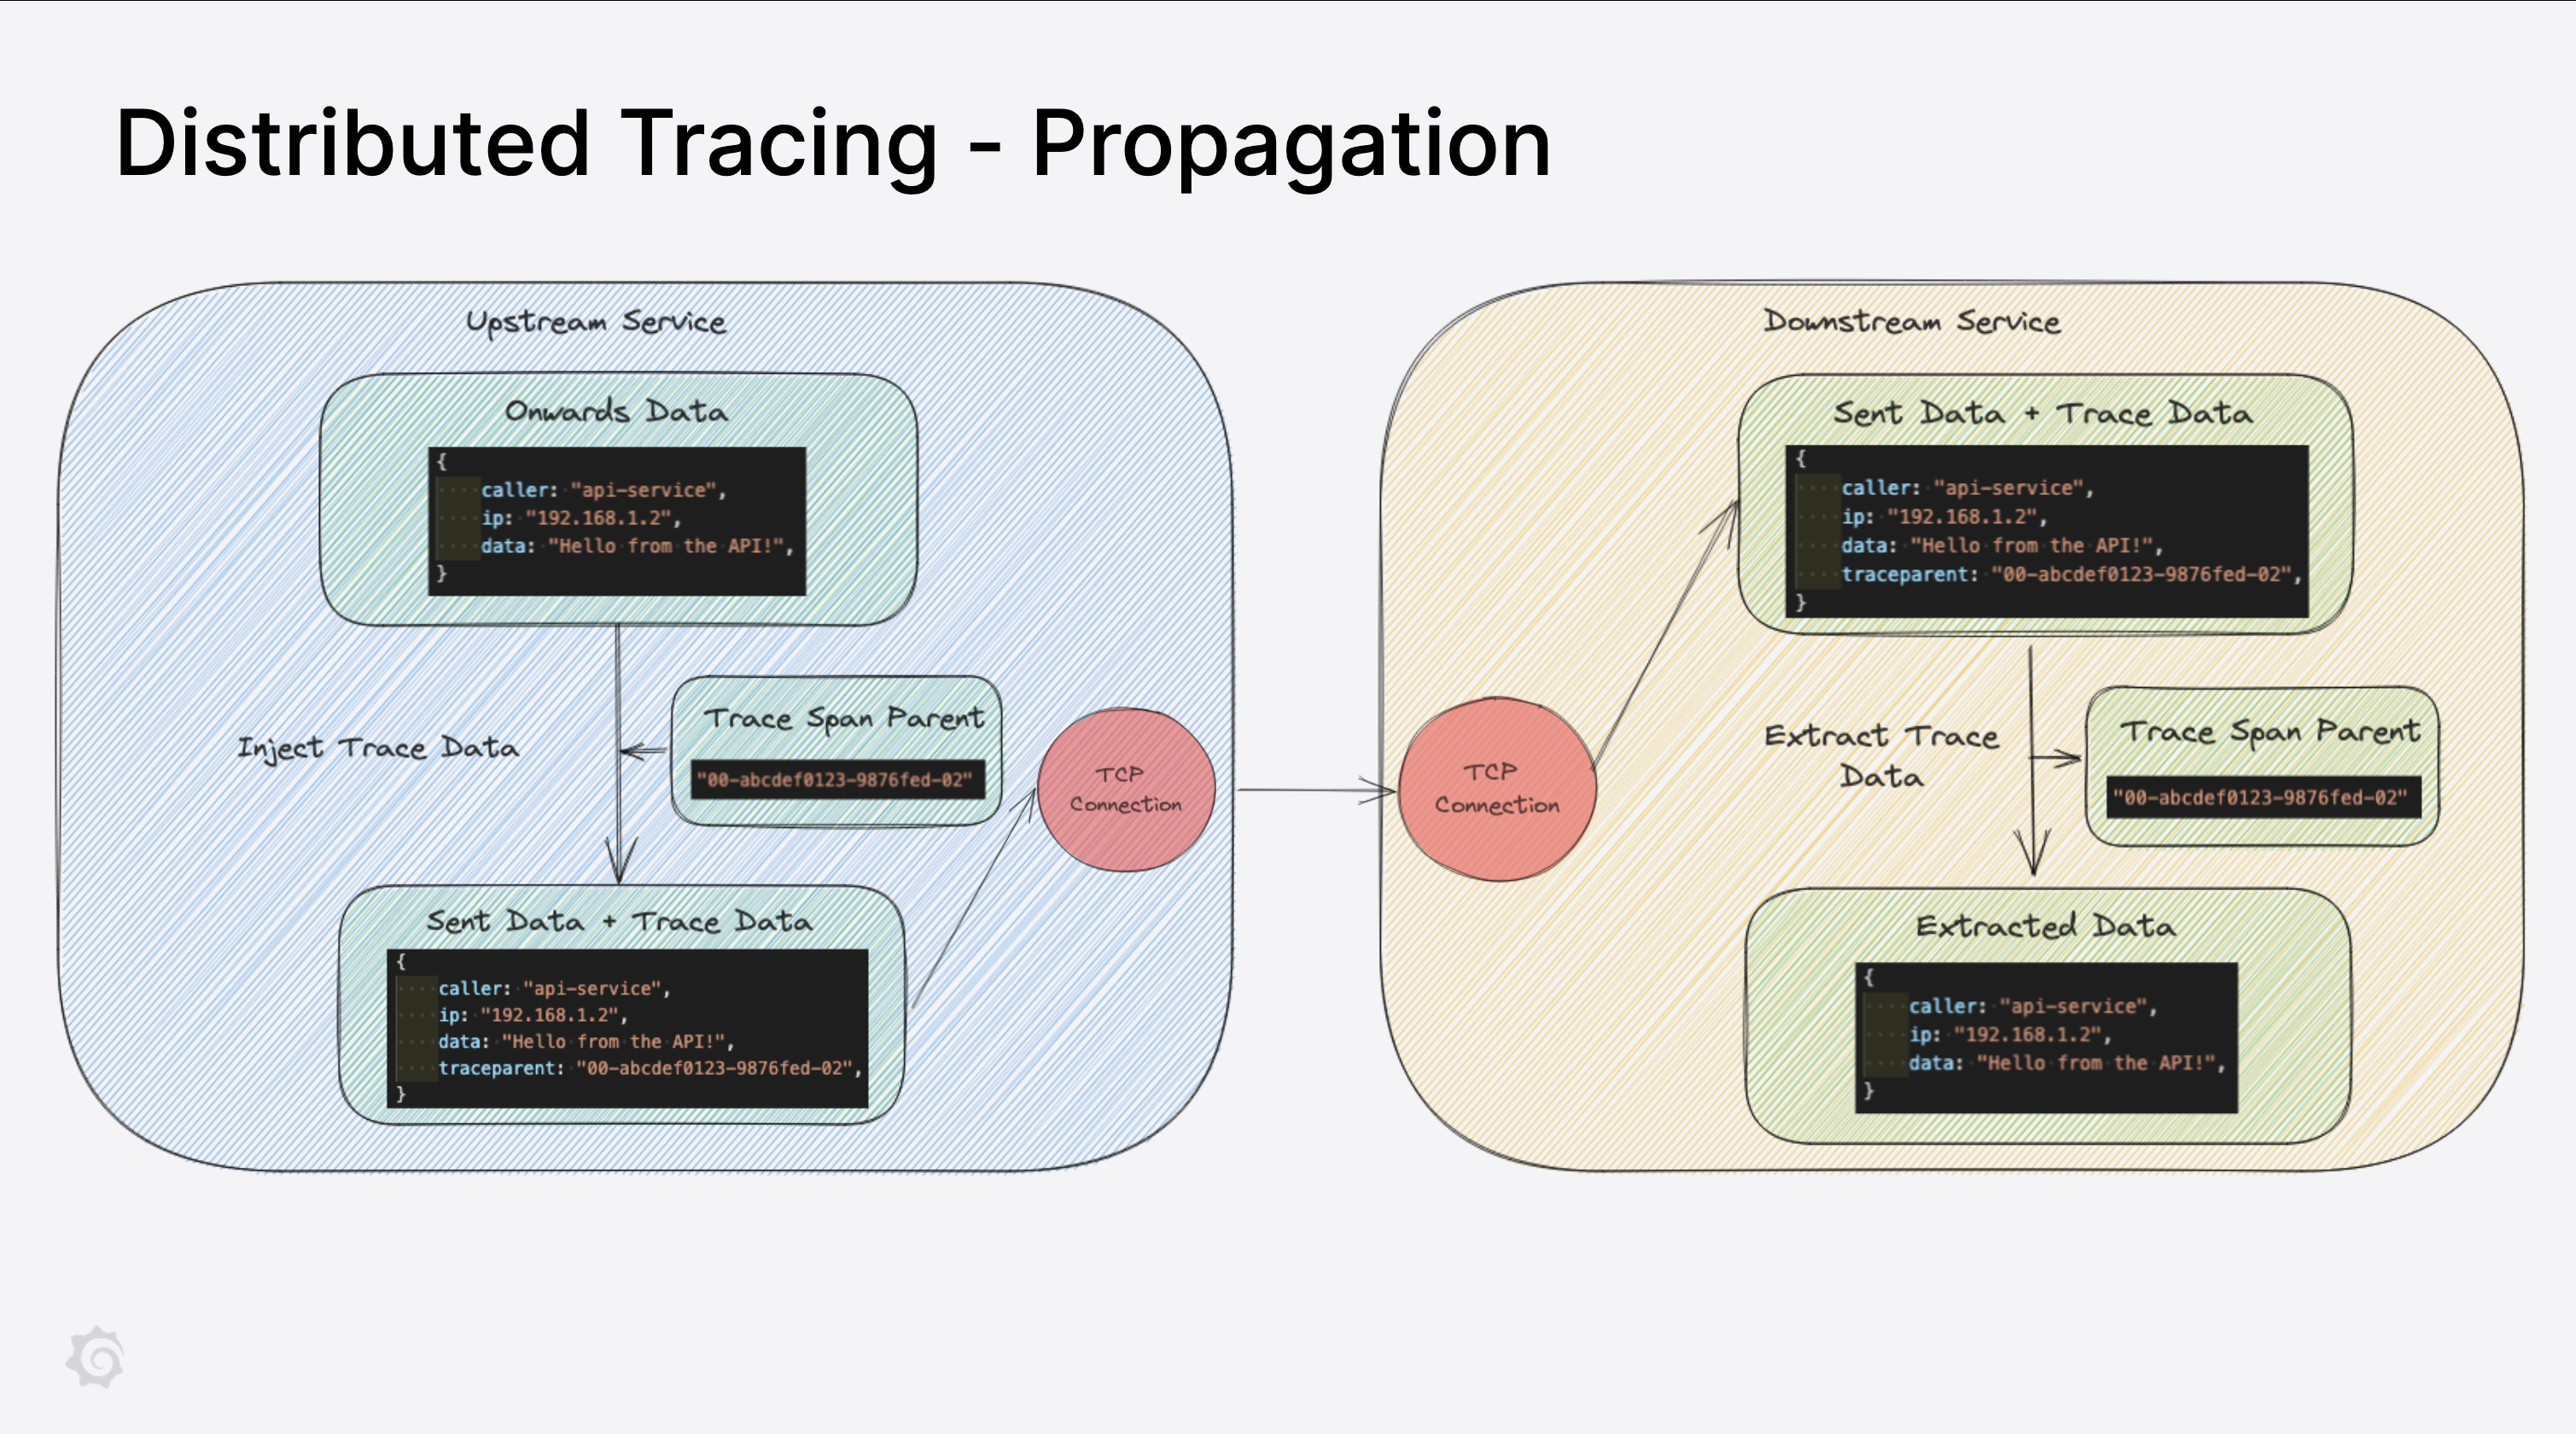
Propagation
Modern applications are not usually not the monolithic applications of old, where single binaries contained all of the code, and multiple instances of the monoliths were run to ‘scale’ to increased traffic. Modern applications are built using a large number of microservices, each one specifically designed to handle specific portions of a request/data flow.
Traces are (usually) tied to a request/response model, being initiated when a request is received by application and ending when a response is returned. Each request could flow through a number of different services (eg. an API service, a caching service, a processing service, a database service, etc.), and therefore to ensure that the trace includes every service that the data is routed through there needs to be some way of sending the details about a trace with the data that’s sent to each service.
This is called trace propagation, and the actual mechanics of it alter depending on the way that data is passed around services. The majority of services in the modern application world use REST (via HTTP) or protobufs (via gRPC, which is itself handled by HTTP/2). Because a trace is just a metaobject comprised of spans, all that needs to happen to continue a trace from one service to another is the addition of a trace ID and the last current span ID to the data send to a downstream service.
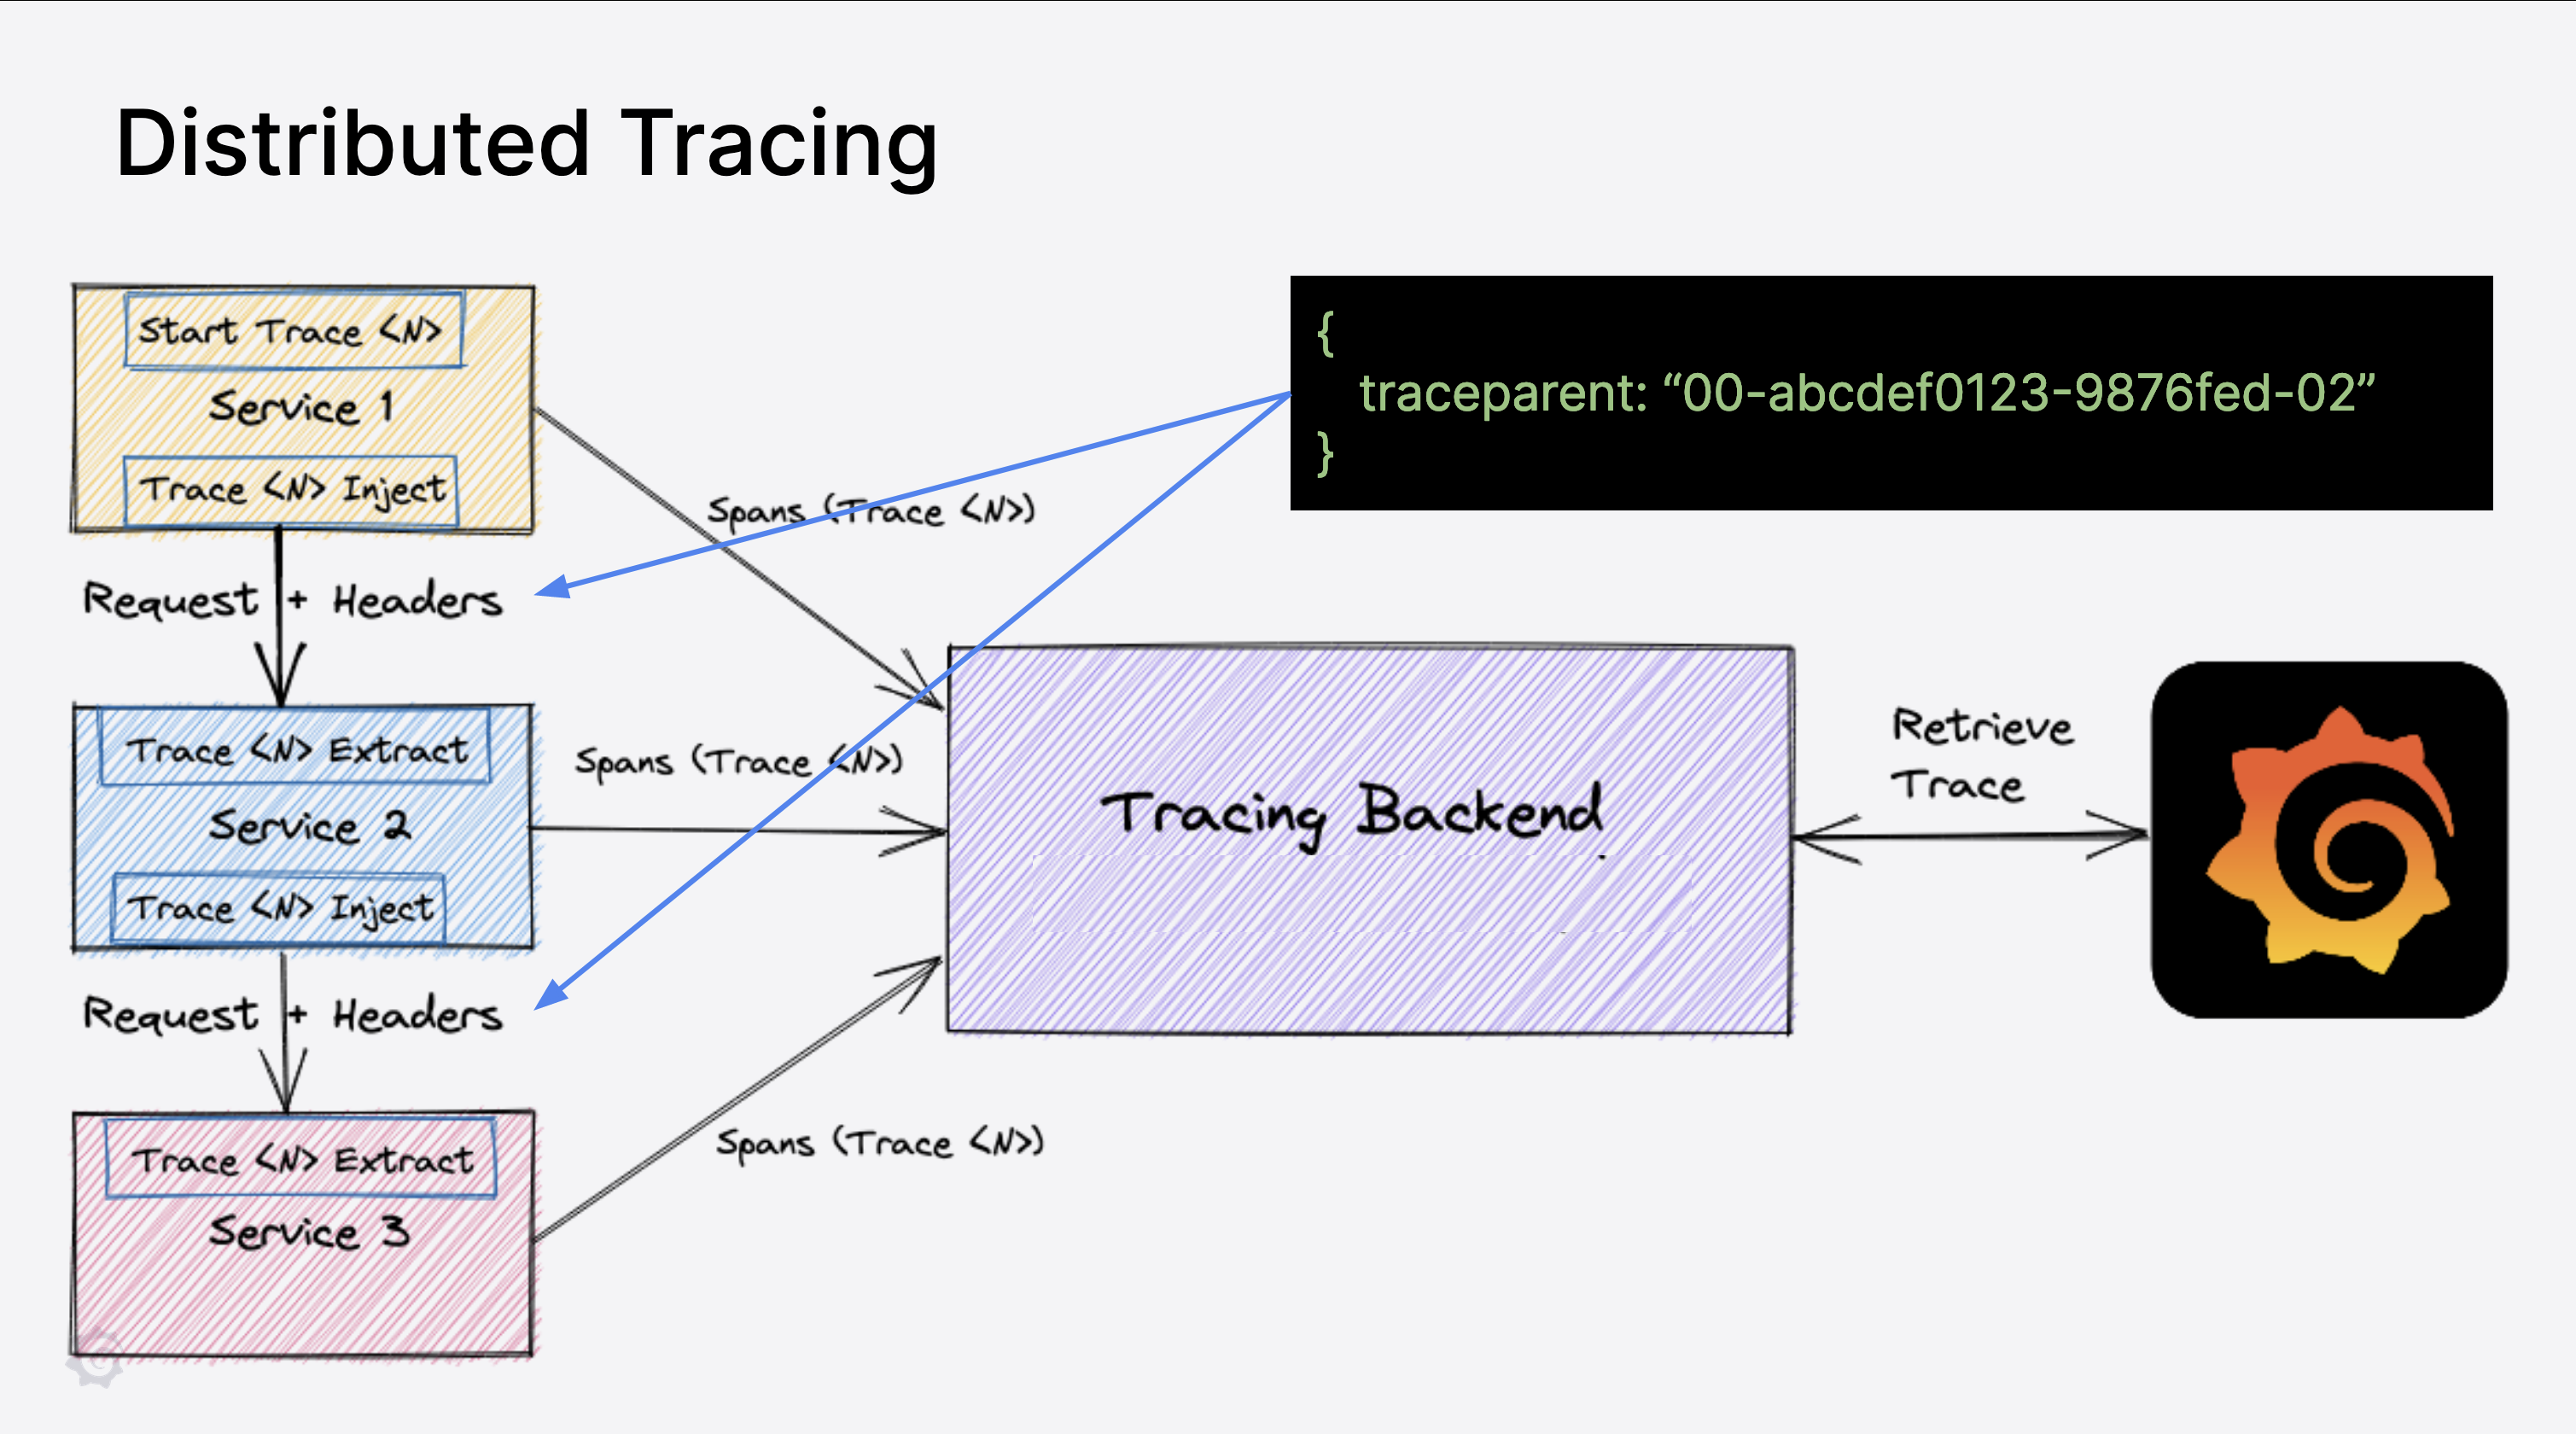
Many instrumentation SDKs, include propagators that can handle a number of different transport protocols, and when matched with appropriate auto-instrumentation mean that an engineer doesn’t even have to consider writing any code to inject the downstream data with the trace information, it gets handled automatically (for example in the case of HTTP, headers are included that specifically deal with trace information that gets extracted by the OpenTelemetry SDK in the downstream service to carry on a trace).
The W3C Trace Context is the default way of sending propagation information in OpenTelemetry SDKs. However, the SDK also allows you to provide custom propagators to it instead, which means that if an application uses a custom protocol or networking scheme, engineers can write propagators and extractors to handle these as well.