
This is documentation for the next version of Grafana Tempo documentation. For the latest stable release, go to the latest version.
Version 2.9 release notes
The Tempo team is pleased to announce the release of Tempo 2.9.
This release gives you:
- New MCP (Model Context Protocol) server support for LLM integration with tracing data
- Enhanced TraceQL metrics with sampling capabilities for improved performance
- Significant operational improvements for multi-tenant environments
- Numerous TraceQL performance and correctness improvements
These release notes highlight the most important features and bug fixes. For a complete list of changes, refer to the Tempo CHANGELOG.
To learn more about this release, refer to the Tempo 2.9 blog post.
Access tracing data with the Tempo MCP server
Note
Tempo MCP server is an experimental feature. Engineering and on-call support is not available. Documentation is either limited or not provided outside of code comments. No SLA is provided. Enable the feature toggle in Grafana to use this feature. Do not enable this feature in production environments.
Tempo 2.9 includes an MCP (Model Context Protocol) server that provides AI assistants and Large Language Models (LLMs) with direct access to distributed tracing data through TraceQL queries and other endpoints. (PR 5212)
MCP is a widely adopted protocol, developed by Anthropic, that standardizes how applications provide context to large language models (LLMs). By integrating MCP with Tempo, you can now leverage LLM-powered tools like Claude Code or Cursor to analyze and derive value from your tracing data. This allows you to better understand interactions between your services and investigate and diagnose issues faster.
Warning
Using this feature will likely cause tracing data to be passed to an LLM or LLM provider. Consider the content of your tracing data and organizational policies when enabling the MCP server.
The feature is disabled by default and can be enabled per tenant for specific use cases.
Refer to MCP server for configuration details and examples.
For more information, refer to LLM-powered insights into your tracing data: introducing MCP support in Grafana Cloud Traces.
TraceQL metrics sampling
TraceQL metrics sampling, using with(sample=true), dynamically and automatically chooses how to sample your tracing data to give you the highest quality signal with examining as little data as possible. (PR 5469)
This sampling method uses an adaptive probabilistic approach that responds to how common spans and traces matching the query are.
This sampling is applied at the storage layer, for example, only inspecting xx% spans, or xx% traces, depending on the needs of the query.
When there is a lot of data, it lowers the sampling rate. When matches are rare it keeps the sampling rate higher, possibly never going below 100%. Therefore the performance gain depends on the query.
This behavior can be overridden to focus more on fixed span sampling using with(span_sample=0.xx) or fixed trace sampling using with(trace_sample=0.xx).(PR 5469)
Example:
{} | rate() with(sample=true)
{} | rate() with(span_sample=0.1)
To learn more, refer to TraceQL metrics sampling.
Adaptive sampling was featured in the September 2025 Tempo community call. Watch the recording starting at the 12:00 minute mark to learn more.
Features and enhancements
The most important features and enhancements in Tempo 2.9 are highlighted below.
Operational improvements
These improvements help operators running multi-tenant Tempo deployments improve trace quality and operational visibility.
SLO metrics improvements
Cached querier responses are now excluded from SLO metrics such as inspected bytes, providing more accurate measurements of actual storage and network I/O. This change ensures that performance metrics reflect real resource consumption rather than cached data access. (PR 5185)
Enhanced monitoring and observability
Several new metrics and histograms have been added to improve operational visibility:
- Added counter
query_frontend_bytes_inspected_totalto track total bytes read from disk and object storage. (PR 5310, documentation) - Added histograms
spans_distance_in_future_seconds/spans_distance_in_past_secondsthat count spans with timestamps outside expected ranges. While spans in the future are accepted, they are invalid and may not be found using the Search API. (PR 4936, documentation) - Added support for scope in cost-attribution usage tracker, allowing more precise tracking with
resource.orspan.prefixed attributes. (PR 5646, documentation) - Logging and tracing in the write path now includes tenant information. The
distributor.ConsumeTracesspan status is now properly set to error when trace consumption fails. (PR 5436)
Ingress bytes monitoring
The new metric tempo_distributor_ingress_bytes_total measures bytes received before limits are applied, providing better visibility into incoming data volumes and helping with capacity planning. (PR 5601)
Metrics-generator improvements
The following improvements have been made to the metrics-generator:
The definition of
tempo_metrics_generator_processor_service_graphs_expired_edgeshas been adjusted to exclude edges that are properly counted in the service graph. This provides more accurate metrics for monitoring service graph health and completeness. (PR 5319, documentation)Invalid Prometheus label names are now automatically dropped in the span metrics processor, preventing metric ingestion errors and ensuring compatibility with Prometheus naming conventions. (PR 5122)
Added support for the new
db.namespaceattribute for service graph database nodes, aligning with newer OpenTelemetry semantic conventions. This provides better categorization and visualization of database interactions in service graphs. (PR 5602, documentation)Service graph client virtual nodes now use peer attributes to determine client service names, providing more accurate representation of service-to-service communications in distributed systems. (PR 5381, documentation)
TraceQL correctness and performance improvements
TraceQL metrics have received several important updates that improve correctness and performance. Refer to Upgrade considerations for breaking changes that may affect your deployment.
- Improved exemplar selection in
quantile_over_time()function provides better representative samples (PR 5278) - Fixed issue preventing very small time steps in metrics queries (PR 5441)
- Fixed incorrect TraceQL string comparison for strings starting with numbers (PR 5658)
- Fixed incorrect results in TraceQL
compare()function for spans with array attributes (PR 5519) - Fixed structural operator behavior with empty left-hand spansets (PR 5578)
Performance improvements
The following improvements have been made to TraceQL query performance:
- Performance increase for basic TraceQL metrics queries through reduced overhead in batch processing (PR 5247)
- General TraceQL search and metrics performance improvements (PR 5280)
- TraceQL performance improvements for complex queries (PR 5218)
- Optimized
compare()function performance (PR 5419) - TraceQL attribute
structalignment for better memory performance (PR 5240)
Upgrade considerations
When upgrading to Tempo 2.9, be aware of these considerations and breaking changes.
RPM and DEB packages discontinued
Tempo no longer publishes RPM and DEB packages due to an internal change to the handling of signing keys. This can be restored if customers need these packages. (PR 5684)
Migrated Vulture and integration tests to OTLP exporter
In this release, we’ve migrated Tempo Vulture and Integration Tests from the deprecated Jaeger agent/exporter to the standard OTLP exporter. Vulture now pushes traces to the Tempo OTLP GRCP endpoint. (PR 5058)
Bucket calculation changes
TraceQL metrics buckets are now calculated based on data in the past instead of the future, which aligns behavior with Prometheus. This resolves issues with empty last buckets that were previously encountered. (PR 5366)
This change may cause differences in existing dashboards and alerts that rely on TraceQL metrics bucket calculations. Review your monitoring and alerting configurations after upgrading.
Series label handling improvements
Fixed incorrect TraceQL metrics results when series labels include both strings and integers with the same textual representation (such as "500" vs 500). The prom_labels field has been removed from TraceQL metrics responses as it was the source of these errors. (PR 5659)
There may be brief interruptions to TraceQL metrics queries during rollout while components run different versions. Plan for a coordinated rollout to minimize impact.
vParquet5 block format
Tempo 2.9 introduces a new experimental vParquet5 block format, designed to improve query performance and reduce storage requirements.vParquet5 has two previews: vParquet5-preview1, low-resolution timestamp columns, and vParquet5-preview2, dedicated integer columns.
Breaking changes are expected before the final release. (PR 5495, PR 5639)
Go version upgrade
Tempo 2.9 upgrades to Go 1.25.0, which may affect custom builds or deployments with specific Go version requirements. (PR 5548)
If you’re building Tempo from source or using custom Docker images, ensure your build environment supports Go 1.25.0.
Project Rhythm: New Tempo architecture
Project Rhythm is the codename for the new architecture project for Tempo. The main objective of this project is to address certain trade-offs of the current design that are limiting the ability of Tempo to grow and support new functionalities.
The goals of this project are to:
- Eliminate the requirement for replication factor 3 (RF3) -> Support high availability and improve reliability of TraceQL metrics
- Decouple the read and write path -> Scalability and reliability
- Lay out the foundation to significantly reduce total cost of ownership (TCO) -> Room for growth
Project Rhythm has been discussed in the Tempo Community Calls for several months. Refer to the Tempo Community Calls on YouTube to learn more.
Refer to the Tempo Rearchitecture section in the Tempo 2.9 changelog for the list of pull requests that are part of this project.
Current problems
The current Tempo architecture has the following problems:
- Lack of high-availability for reads in TraceQL metric queries: if a generator is down, the data which that generator holds becomes unavailable. This can be improved or mitigated in certain cases, such as rollouts by rolling updates, but never fully solved.
- Low write reliability: to reduce the impact that the generators have on the read path, generator ingestion is asynchronous and doesn’t return errors to the client. While this is important to protect the ingester’s write path, it adds unreliability to generator’s ingestion.
- High TCO: TraceQL metrics in the generators are based on flushing a new set of blocks of data, in addition to the ingester’s blocks. These two sets of blocks remain separated in compaction, making 2 copies the best case scenario in long-term storage—research shows we’re closer to 3-3.5 in real world scenarios.
Architecture comparison
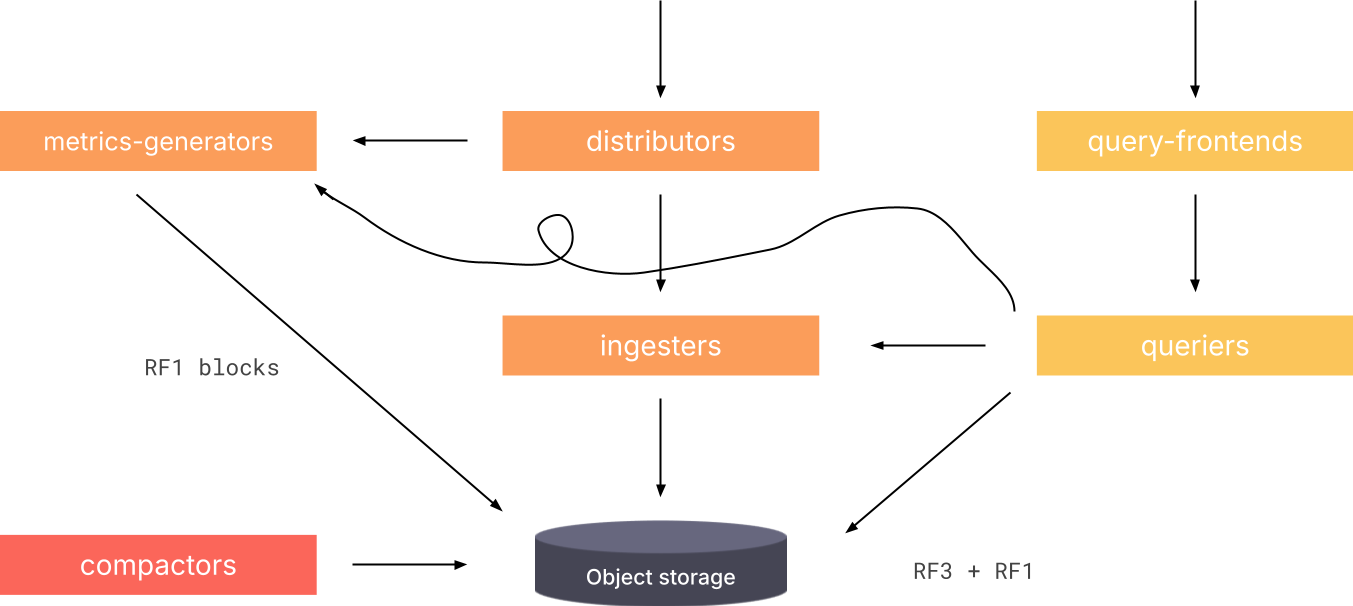
The current Tempo architecture includes distributors, ingesters, query frontend, queriers, compactors, object storage, and the metrics-generator.
Refer to Tempo architecture for more information.
The diagram illustrates the current Tempo architecture.
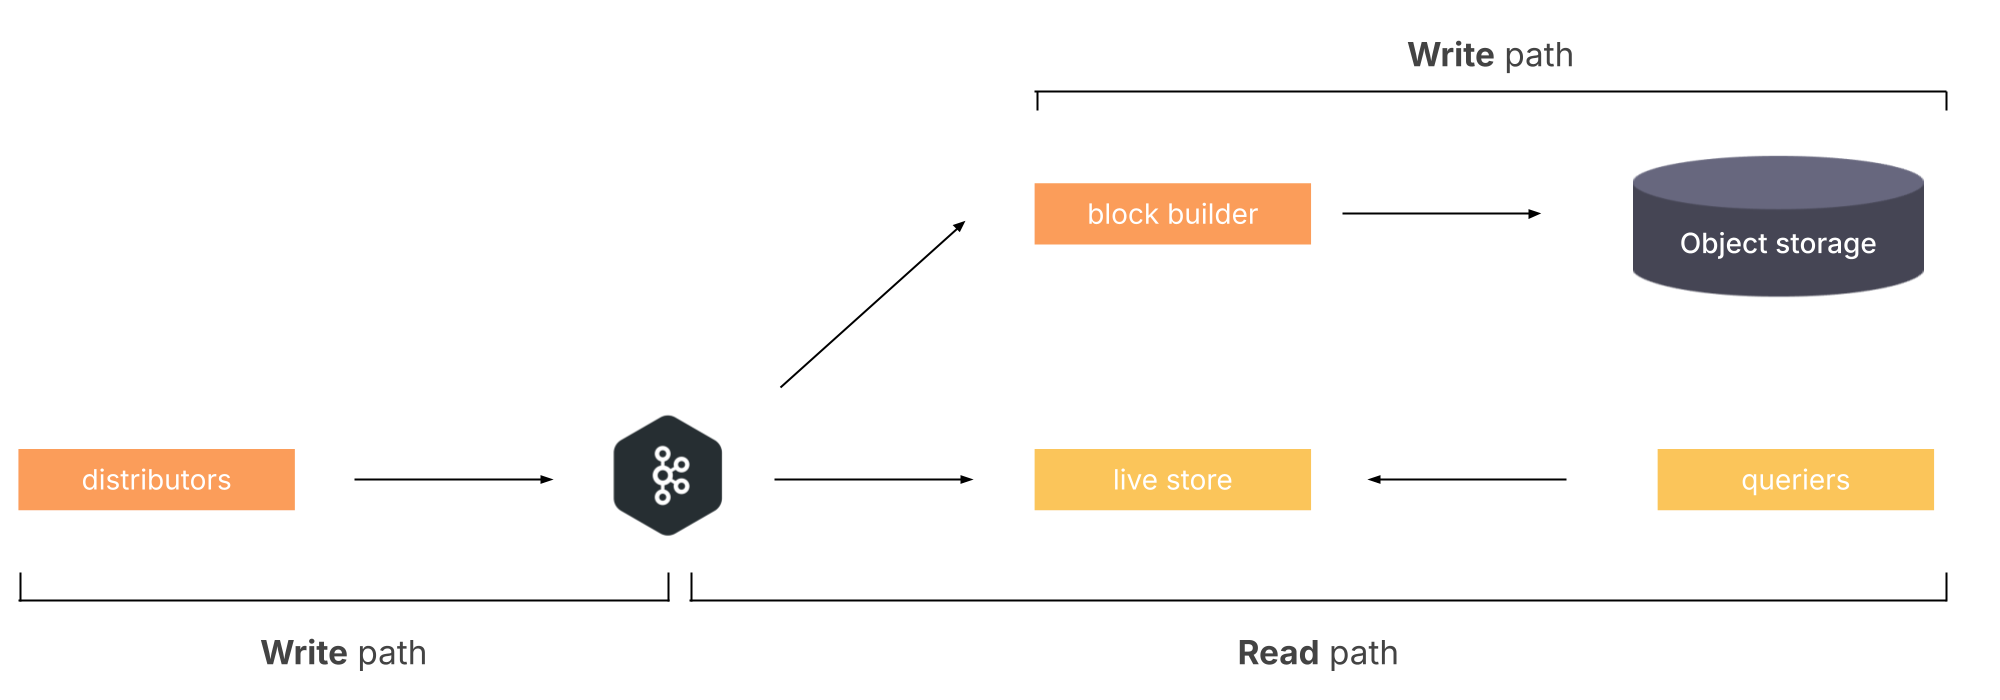
Project Rhythm works as follows:
- Distributors write incoming requests to Kafka.
- Ingesters are substituted by live-stores, a read-path component, replaying from Kafka. Live-stores responsibility is to serve trace queries
- A new component, the block-builder, is introduced to the write path. This component is tasked with replaying from Kafka to build blocks which are sent to long-term storage.
Security fixes
The following updates were made to address security issues.
2.9.1
- Updated Go to version 1.25.5 to address CVE-2025-61729, CVE-2025-47907, CVE-2025-58183, and CVE-2025-61727. [PR 6089, PR 6096, PR 6233]
- Updated
golang.org/x/cryptoto address CVE-2025-47914, and CVE-2025-58181. [PR 6235] - Updated
github.com/expr-lang/exprto v1.17.7 to address CVE-2025-68156. [PR 6234]
Bug fixes
For a complete list, refer to the Tempo CHANGELOG.
- Fixed Tempo configuration options that are always overridden with configuration overrides section. (PR 5202)
- Correctly apply trace idle period in ingesters and add the concept of trace live period. (PR 5346)
- Fixed invalid YAML output from
/status/runtime_configendpoint by adding document separator. (PR 5371) - Fixed panic in
query_rangeHTTP handling that could be triggered by cancellations or other errors. (PR 5667) - Fixed cache collision for incomplete query in SearchTagValuesV2 (PR 5549)
- Deadlock on invalid query to
api/v2/search/tags. (SearchTagsV2) (PR 5607) - Fixed incorrect root span detection when spans have a
child_oflink but no parent. (PR 5557) - Prevent metrics-generator WAL deletion when tenant is empty. (PR 5586)
- Fixed docker-compose port configuration for Alloy gRPC (
4319to4317). (PR 5536) - Fixed panic error from empty span id. (PR 5464)
- Return
Bad Requestfrom frontend if the provided tag is invalid inSearchTagValuesV2endpoint. (PR 5493)

