
TraceQL
TraceQL is a query language designed for selecting traces in Tempo.
Distributed traces contain a wealth of information, and tools like auto-instrumentation make it easy to start capturing data. Extracting value from traces can be much harder. For example, Tempo metrics-generator can aggregate traces into service graphs and span metrics, and exemplars allow you to navigate from a spike in API latency to a trace that contributed to that spike. But traces can do so much more.
Traces are the flow of events throughout your components. They have a tree structure—-with a root, branches, and leaves—-arbitrary key/value data at any location, and of course timestamps. What new questions can be answered with this structure? More than just finding isolated events, can we find sequences of events?
For example, you can use traces to perform root cause analyses (RCA) on a service outage and use TraceQL to pinpoint the root cause. Refer to Diagnose errors with traces for a use case example.
Get started with TraceQL
Use these references to get started with TraceQL:
- Determine the information you want to query by understanding the relationship of queries to trace structure and spans.
- Construct a query to locate the information. Use the examples and language reference to learn about the syntax and semantics of TraceQL.
TraceQL uses similar syntax and semantics as PromQL and LogQL, where possible.
There’s supposed to be a video here, but for some reason there isn’t. Either we entered the id wrong (oops!), or Vimeo is down. If it’s the latter, we’d expect they’ll be back up and running soon. In the meantime, check out our blog!
How can you use TraceQL?
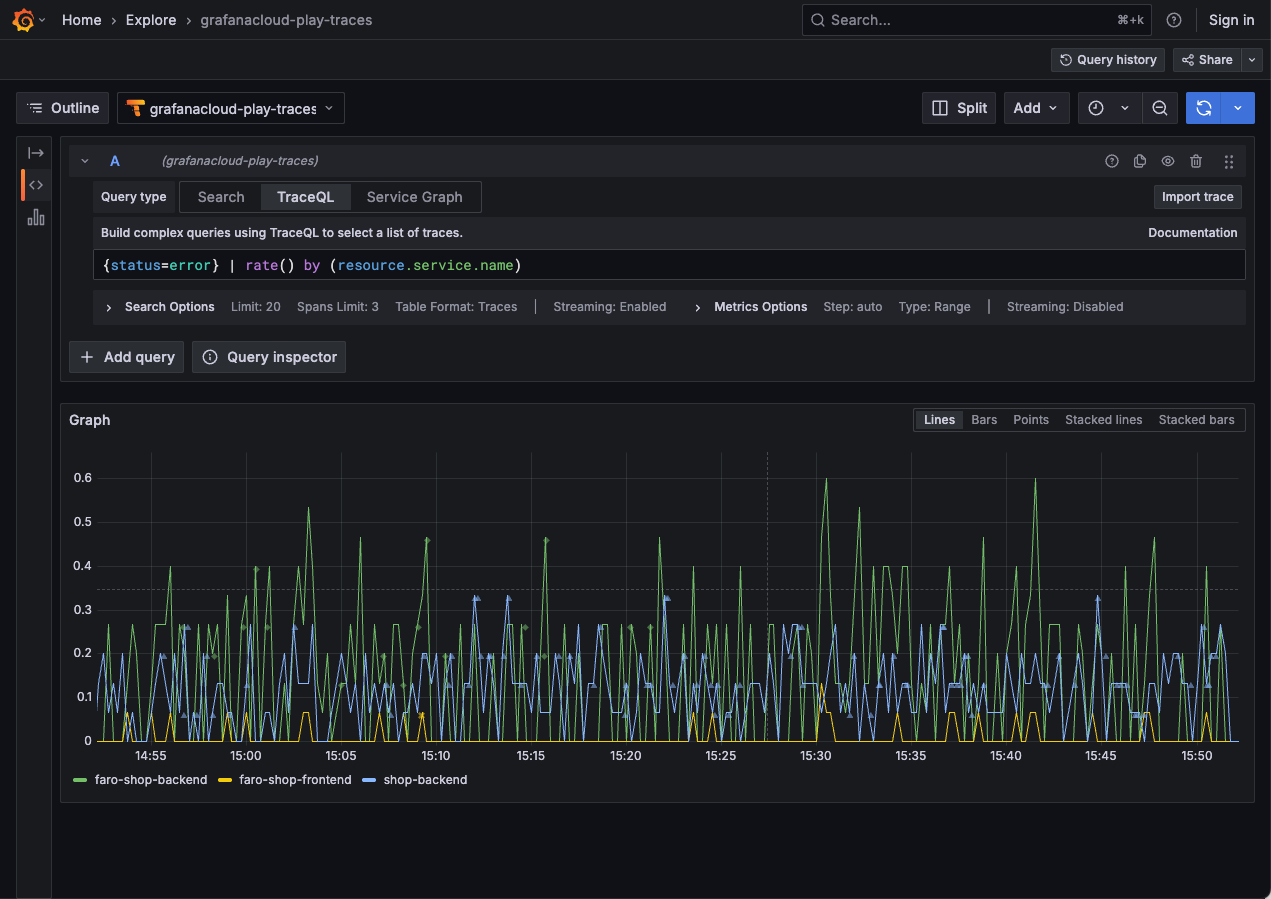
You can use TraceQL queries using the command line or in Grafana with the query editor and query builder. The query editor and builder are available in the Tempo data source for Grafana Explore.
In addition, you can use Traces Drilldown to investigate your tracing data without writing TraceQL queries. For more information, refer to the Traces Drilldown documentation.
For more information, refer to Write TraceQL queries in Grafana.
Metrics from traces with TraceQL
TraceQL metrics generate metrics from traces and let you use TraceQL to query metrics. Refer to TraceQL metrics for more information.
Caution
TraceQL metrics is an public preview feature. Grafana Labs offers limited support, and breaking changes might occur prior to the feature being made generally available TraceQL metrics are enabled by default in Grafana Cloud.
Resources
TraceQL requires the Parquet columnar format, which is the default block format for Tempo. Refer to the Apache Parquet backend documentation.
Refer to the Tempo release notes for the latest updates to TraceQL.

