
This is documentation for the next version of Grafana Pyroscope documentation. For the latest stable release, go to the latest version.
Node.js
Enhance your Node.js application’s performance with our Node.js Profiler. Seamlessly integrated with Pyroscope, it provides real-time insights into your application’s operation, helping you identify and resolve performance bottlenecks. This integration is key for Node.js developers aiming to boost efficiency, reduce latency, and maintain optimal application performance.
Note
Refer to Available profiling types for a list of profile types supported by each language.
Before you begin
To capture and analyze profiling data, you need either a hosted Pyroscope OSS server or a hosted Pyroscope instance with Grafana Cloud Profiles (requires a free Grafana Cloud account).
The Pyroscope server can be a local server for development or a remote server for production use.
Add Node.js profiling to your application
To start profiling a Node.js application, you need to include the npm module in your app:
npm install @pyroscope/nodejs

# or
yarn add @pyroscope/nodejs
Configure the Node.js client
Add the following code to your application:
const Pyroscope = require('@pyroscope/nodejs');

Pyroscope.init({
    serverAddress: 'http://pyroscope:4040',
    appName: 'myNodeService',
    // Enable CPU time collection for wall profiles
    // This is required for CPU profiling functionality
    // wall: {
    //   collectCpuTime: true
    // }
});

Pyroscope.start()
Note
If you’d prefer, you can use Pull mode using Grafana Alloy.
Configuration options
Add profiling labels to Node.js applications
Static labels
You can add static labels to the profiling data. These labels can be used to filter the data in the UI and apply for all profiles collected. Common static labels include:
hostnameregionteam
Pyroscope.init({
  serverAddress: 'http://pyroscope:4040',
  appName: 'myNodeService',
  tags: {
    region: ENV['region']
  },
});

Pyroscope.start()
Dynamic labels for Wall/CPU profiles
In Wall and CPU profiles, labels can also be attached dynamically and help to separate different code paths:
Pyroscope.wrapWithLabels({ vehicle: 'bike' }, () =>
  slowCode()
);
Send data to Pyroscope OSS or Grafana Cloud
Pyroscope.init({
  serverAddress: 'http://pyroscope:4040',
  appName: 'myNodeService',
  tags: {
    region: ENV['region']
  },
  basicAuthUser: ENV['PYROSCOPE_BASIC_AUTH_USER'],
  basicAuthPassword: ENV['PYROSCOPE_BASIC_AUTH_PASSWORD'],
  // Optional Pyroscope tenant ID (only needed if using multi-tenancy). Not needed for Grafana Cloud.
  // tenantID: ENV['PYROSCOPE_TENANT_ID'],
});

Pyroscope.start()
To configure the Node.js SDK to send data to Pyroscope, replace the serverAddress placeholder with the appropriate server URL. This could be the Grafana Cloud Pyroscope URL or your own custom Pyroscope server URL.
If you need to send data to Grafana Cloud, you’ll have to configure HTTP Basic authentication. Replace basicAuthUser with your Grafana Cloud stack user ID and basicAuthPassword with your Grafana Cloud API key.
If your Pyroscope server has multi-tenancy enabled, you’ll need to configure a tenant ID. Replace tenantID with your Pyroscope tenant ID.
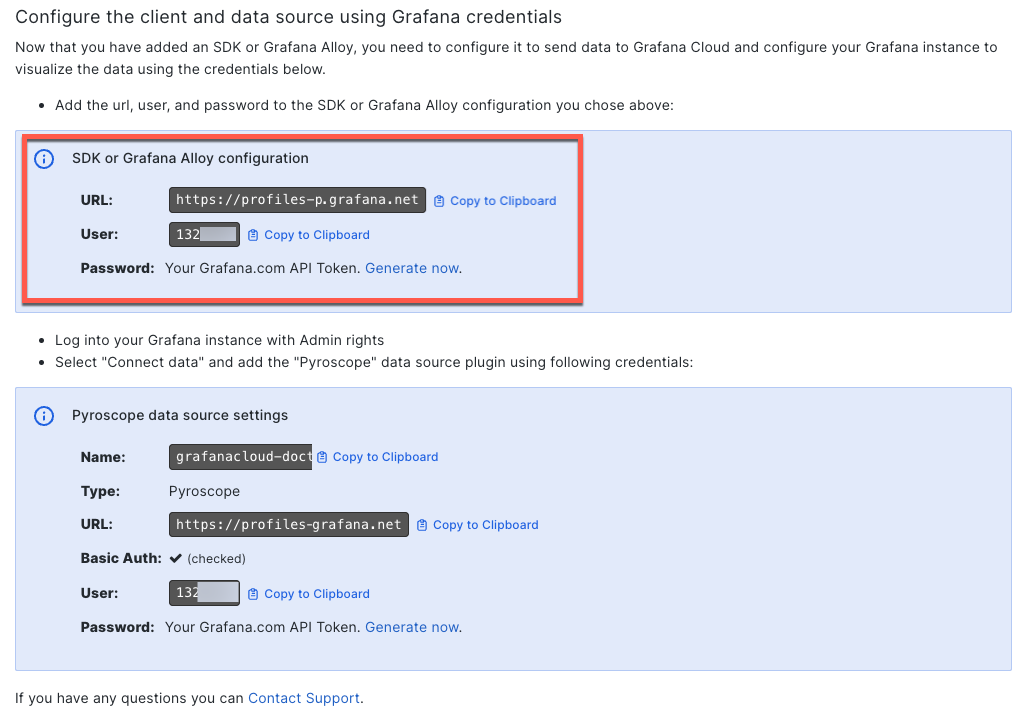
Locate the URL, user, and password in Grafana Cloud Profiles
When you configure Alloy or your SDK, you need to provide the URL, user, and password for your Grafana Cloud stack. This information is located in the Pyroscope section of your Grafana Cloud stack.
- Navigate to your Grafana Cloud stack.
- Select Details next to your stack.
- Locate the Pyroscope section and select Details.
- Copy the URL, User, and Password values in the Configure the client and data source using Grafana credentials section.
![Locate the SDK or Grafana Alloy configuration values]()
- Use these values to complete the configuration.
As an alternative, you can also create a Cloud Access Policy and generate a token to use instead of the user and password. For more information, refer to Create a Cloud Access Policy.
Troubleshoot
Setting DEBUG env to pyroscope provides additional debugging information.
DEBUG=pyroscope node index.js
