Java
The Java Profiler, integrated with Pyroscope, offers a comprehensive solution for performance analysis in Java applications. It provides real-time insights, enabling developers to understand and optimize their Java codebase effectively. This tool is crucial for improving application responsiveness, reducing resource consumption, and ensuring top-notch performance in Java environments.
Note
Refer to Available profiling types for a list of profile types supported by each language.
Before you begin
To capture and analyze profiling data, you need either a hosted Pyroscope OSS server or a hosted Pyroscope instance with Grafana Cloud Profiles (requires a free Grafana Cloud account).
The Pyroscope server can be a local server for development or a remote server for production use.
Add Java profiling to your application
Java integration is distributed as a single jar file (pyroscope.jar) or a Maven package.
Supported platforms include:
- Linux on x64
- Linux on ARM64
- MacOS on x64
- MacOS on ARM64
Visit the GitHub releases page to download the latest version of pyroscope.jar.
The latest release is also available on Maven Central.
Configure the Java client
You can start Pyroscope either from your application’s code or attach it as javaagent.
Start Pyroscope from app’s Java code
First, add the Pyroscope dependency:
<dependency>
  <groupId>io.pyroscope</groupId>
  <artifactId>agent</artifactId>
  <version>2.1.2</version>
</dependency>implementation("io.pyroscope:agent:2.1.2")Add the following code to your application:
PyroscopeAgent.start(
  new Config.Builder()
    .setApplicationName("ride-sharing-app-java")
    .setProfilingEvent(EventType.ITIMER)
    .setFormat(Format.JFR)
    .setServerAddress("http://pyroscope-server:4040")
    .build()
);import io.pyroscope.javaagent.PyroscopeAgent;
import io.pyroscope.javaagent.config.Config;
import io.pyroscope.javaagent.EventType;
import io.pyroscope.http.Format;
@PostConstruct
public void init() {
PyroscopeAgent.start(
new Config.Builder()
.setApplicationName("ride-sharing-app-java")
.setProfilingEvent(EventType.ITIMER)
.setFormat(Format.JFR)
.setServerAddress("http://pyroscope-server:4040")
// Optionally, if authentication is enabled, specify the API key.
// .setBasicAuthUser("<User>")
// .setBasicAuthPassword("<Password>")
// Optionally, if you'd like to set allocation threshold to register events, in bytes. '0' registers all events
// .setProfilingAlloc("0")
.build()
);
}You can also optionally replace some Pyroscope components:
PyroscopeAgent.start(
  new PyroscopeAgent.Options.Builder(config)
    .setExporter(snapshot -> {
      // Your custom export/upload logic may go here
      // It is invoked every 10 seconds by default with snapshot of
      // profiling data
    })
    .setLogger((l, msg, args) -> {
      // Your custom logging may go here
      // Pyroscope does not depend on any logging library
      System.out.printf((msg) + "%n", args);
    })
    .setScheduler(profiler -> {
      // Your custom profiling schedule logic may go here
    })
    .build()
);
Start Pyroscope as javaagent
To start profiling a Java application, run your application with pyroscope.jar javaagent:
export PYROSCOPE_APPLICATION_NAME=my.java.app
export PYROSCOPE_SERVER_ADDRESS=http://pyroscope-server:4040

java -javaagent:pyroscope.jar -jar app.jar
Add profiling labels to Java applications
You can add dynamic tags (labels) to the profiling data. These tags can filter the data in the UI.
Add labels dynamically:
Pyroscope.LabelsWrapper.run(new LabelsSet("controller", "slow_controller"), () -> {
  slowCode();
});
You can also add static tags (labels) to the profiling data:
Pyroscope.setStaticLabels(Map.of("region", System.getenv("REGION")));
// or with Config.Builder if you start pyroscope with PyroscopeAgent.start
PyroscopeAgent.start(new Config.Builder()
    .setLabels(mapOf("region", System.getenv("REGION")))
    // ...
    .build()
);
Configuration options
When you start Pyroscope as javaagent or obtain configuration by Config.build(), Pyroscope searches
for configuration in multiple sources: system properties, environment variables, and pyroscope.properties.
Property keys have the same names as environment variables, but are in lowercase and underscores (_) are replaced with periods (.). For example, PYROSCOPE_FORMAT becomes pyroscope.format
The Java integration supports JFR format to be able to support multiple events (JFR is the only output format that supports multiple events in async-profiler). There are several environment variables that define how multiple event configuration works:
Send data to Pyroscope OSS or Grafana Cloud Profiles
Add the following code to your application:
PyroscopeAgent.start(
    new Config.Builder()
        .setApplicationName("test-java-app")
        .setProfilingEvent(EventType.ITIMER)
        .setFormat(Format.JFR)
        .setServerAddress("<URL>")
        // Set these if using Grafana Cloud:
        .setBasicAuthUser("<User>")
        .setBasicAuthPassword("<Password>")
        // Optional Pyroscope tenant ID (only needed if using multi-tenancy). Not needed for Grafana cloud.
        // .setTenantID("<TenantID>")
        .build()
);
To configure the Java SDK to send data to Pyroscope, replace the <URL> placeholder with the appropriate server URL. This could be the Grafana Cloud URL or your own custom Pyroscope server URL.
If you need to send data to Grafana Cloud, you’ll have to configure HTTP Basic authentication. Replace <User> with your Grafana Cloud stack user and <Password> with your Grafana Cloud API key.
If your Pyroscope server has multi-tenancy enabled, you’ll need to configure a tenant ID. Replace <TenantID> with your Pyroscope tenant ID.
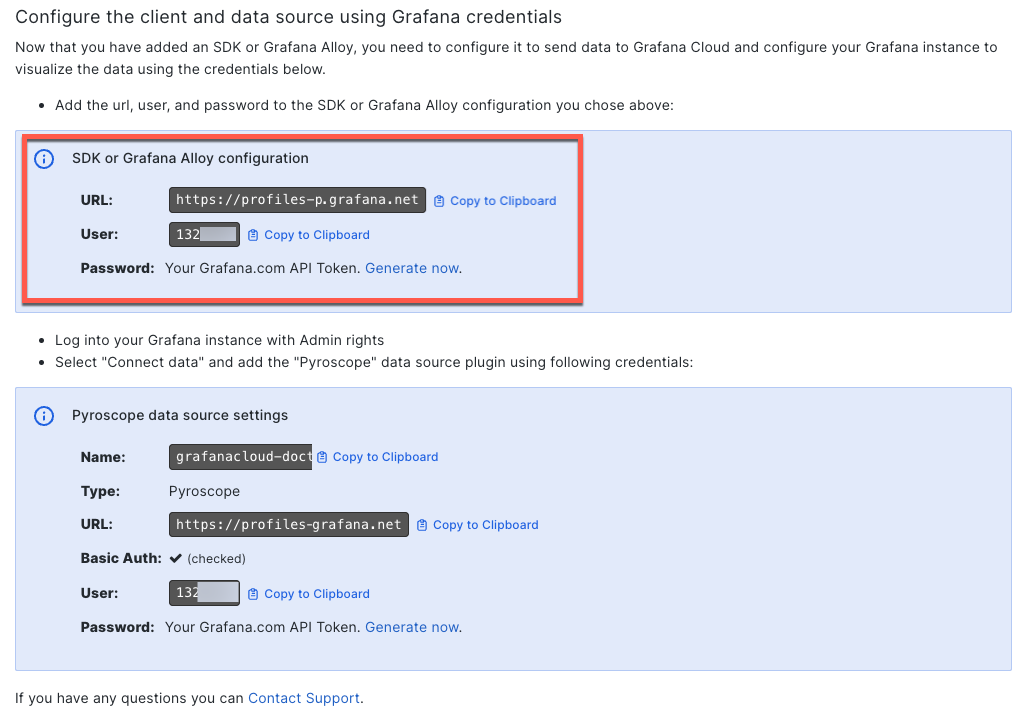
Locate the URL, user, and password in Grafana Cloud Profiles
When you configure Alloy or your SDK, you need to provide the URL, user, and password for your Grafana Cloud stack. This information is located in the Pyroscope section of your Grafana Cloud stack.
- Navigate to your Grafana Cloud stack.
- Select Details next to your stack.
- Locate the Pyroscope section and select Details.
- Copy the URL, User, and Password values in the Configure the client and data source using Grafana credentials section.
![Locate the SDK or Grafana Alloy configuration values]()
- Use these values to complete the configuration.
As an alternative, you can also create a Cloud Access Policy and generate a token to use instead of the user and password. For more information, refer to Create a Cloud Access Policy.
Example configurations
The following configuration sets application name, Pyroscope format, profiling interval, event, and lock.
This example is an excerpt from the rideshare Dockerfile available in the Pyroscope repository.
ENV PYROSCOPE_APPLICATION_NAME=rideshare.java.push.app
ENV PYROSCOPE_FORMAT=jfr
ENV PYROSCOPE_PROFILING_INTERVAL=10ms
ENV PYROSCOPE_PROFILER_EVENT=itimer
ENV PYROSCOPE_PROFILER_LOCK=10ms
This configuration excerpt enables allocation and lock profiling:
PYROSCOPE_PROFILER_ALLOC=512k
PYROSCOPE_PROFILER_LOCK=10ms
Java profiling examples
Check out the following resources to learn more about Java profiling:
- Java examples
- Java Demo showing Java example with tags

