
Multidimensional SLI example
This guide explains what multidimensional SLIs are, how they work, and provides a basic example.
Before you begin, read the SLI availability examples to understand how SLIs are defined in Grafana SLO:
Grafana supports event-based SLIs, which measure the ratio of successful events to total events.
The SLI query result must return a ratio between 0 and 1, where
1means100%of events were successful.Grafana expects SLIs to be expressed as a ratio-like query:
numerator / denominator.
In the availability and latency SLI examples, some SLIs are calculated using the ratio of successful event rates formula:
Success ratio = rate of successful events over a period
                /
                rate of total events over a period
However, this formula is not fully accurate, because Prometheus queries can return multiple series (also called dimensions).
In practice, the final SLIs use sum(...) to aggregate results from all series. The formula looks more like:
Success ratio = sum(rate of successful events over a period)
                /
                sum(rate of total events over a period)
Here, sum(...) aggregates all potential dimensions (all distinct label values) in the numerator and denominator before the final ratio calculation.
This type of SLI is referred to as a roll-up SLI (or aggregated SLI). The following is an example using the Ratio query builder:
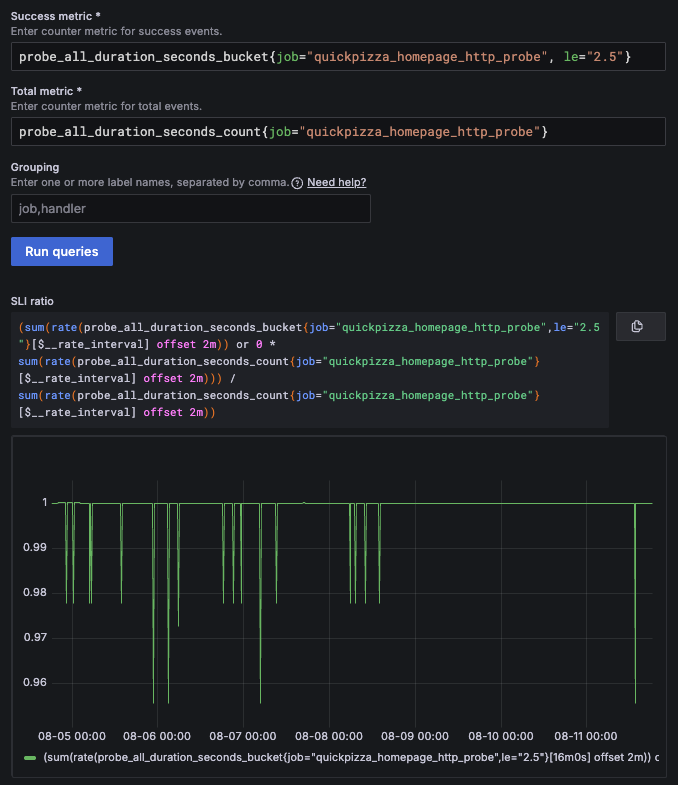
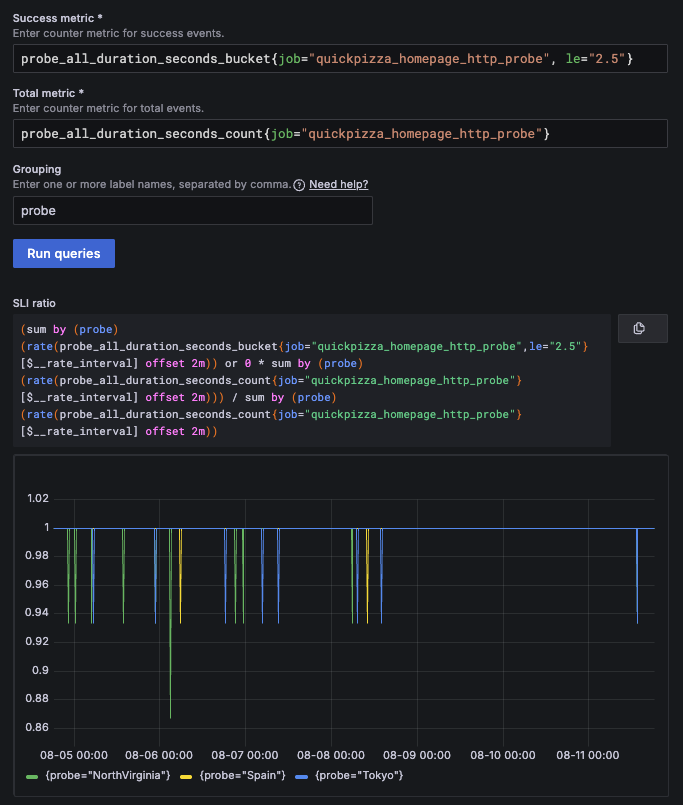
Multidimensional probe example
Multidimensional SLIs (SLIs evaluated across multiple label dimensions) use sum by (<labels>) in both the numerator and denominator, producing multiple ratio series. For example:
Success ratio = sum by (probe) (rate of successful probe executions)
                /
sum by (probe) (rate of total probe executions)| Dimension | Success ratio per dimension |
|---|---|
| {probe=“NorthVirginia”} | 0.9 |
| {probe=“Spain”} | 1 |
| {probe=“Tokyo”} | 0.95 |
The final SLI result is 0.9, equal to its equivalent roll-up SLI.
In the final SLI calculation, all dimensions are aggregated, making it act as a roll-up SLI for SLO compliance.
Continuing with the previous example, use the Grouping function to define dimensions per probe:
Note that you can create multidimensional SLIs using either option in the Grafana SLO wizard: Ratio or Advanced.
How multidimensional SLIs work
For SLO compliance evaluation, the SLI calculation for multidimensional and roll-up SLIs is exactly the same.
However, Grafana SLO provides additional functionality to handle multidimensional SLIs:
Fast and slow burn alerts per dimension. When enabled, Grafana SLO triggers fast-burn or slow-burn alerts whenever an individual dimension consumes the error budget quickly or slowly, respectively.

The SLO dashboard displays the list of multidimensional alerts Note
Multidimensional alerts are not triggered for overall SLO consumption, but only for the consumption of a particular dimension.
To be alerted when the overall error budget is consumed, create a roll-up SLO that does not include the
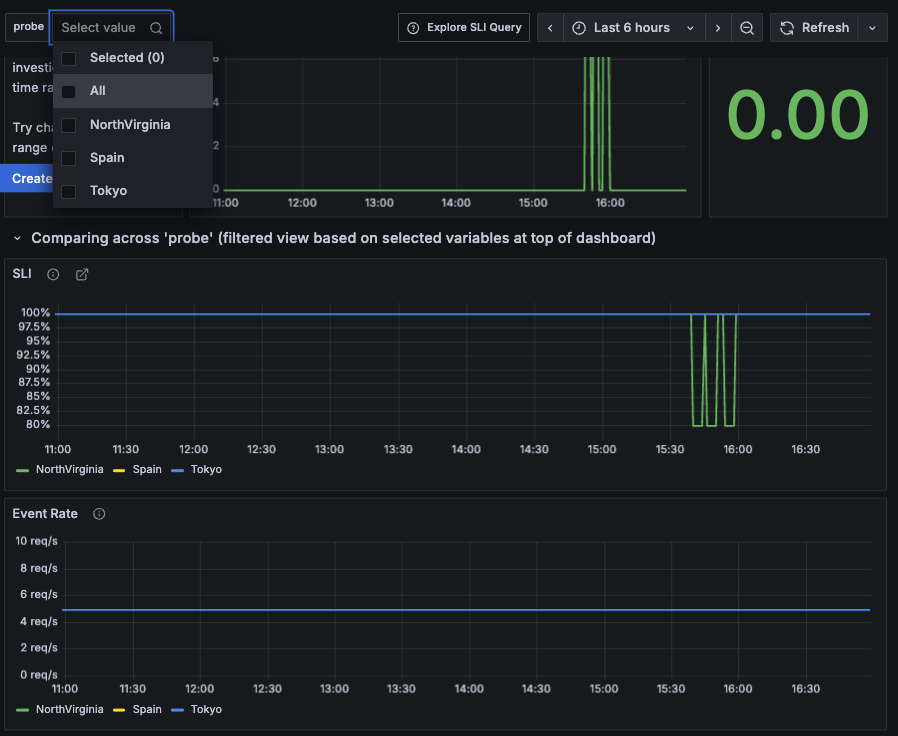
sum/group bydimensions.Per-dimension SLO dashboard filtering. The SLO dashboard allows filtering results and visualizing SLI consumption for each dimension.
![A screenshot of an SLO dashboard that displays SLI consumption per probe]()

Tip
To learn more about how Grafana evaluates metrics with multiple label dimensions, see also Multi-dimensional alert examples.


