SLI examples for Grafana SLO
A Service Level Indicator (SLI) is a metric that measures how well your service is performing from the user’s perspective. SLIs typically track availability, latency, or a custom success rate. For example:
- Latency: requests respond within 2 seconds.
- Availability: requests do not return system errors.
Service Level Objectives (SLOs) defines your reliability goals by setting a target for SLI performance over a specific time window. To define an SLO, pair an SLI with a target and a time window:
| SLI category | SLI description | Target | Time window |
|---|---|---|---|
| Latency | Requests respond within 2 seconds | 99% | 28d |
| Availability | Requests do not return system errors | 99.5% | 7d |
In Grafana, SLIs are defined using data source queries that measure the success rate of the indicator. In the previous examples:
- Latency: the percentage of requests completed within two seconds.
- Availability: the percentage of requests without system errors.
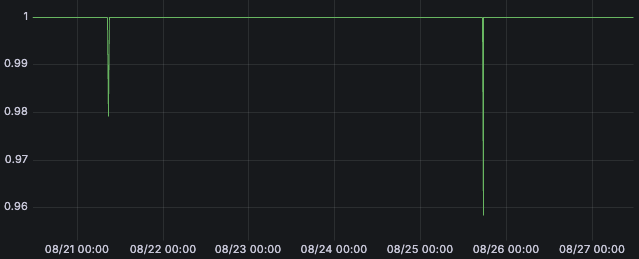
SLI query results must return a value between 0 and 1 for each evaluation period, where 1 represents 100% success and 0 represents 0% success.

Grafana SLO continuously evaluates the SLI query. Each SLI is calculated over a specific time range defined in the query, typically $__interval or $__rate_interval.
| Time range | SLI value (success ratio) |
|---|---|
| 10:00—10:04 | 1.0 |
| 10:00—10:08 | 0.98 |
| 10:00—10:12 | 0.99 |
| 10:00—10:16 | 1.0 |
Grafana SLO aggregates these per-interval values over the selected time window to determine the overall success and remaining error budget.
SLI calculation types
SLIs typically use one of two calculation types:
Event-based SLIs (also called occurrence-based, request-based, or ratio-based SLIs)
They calculate the SLI by comparing successful events to total events. There are two common ways to express this, depending on the metric type:
Using rates of events
Success ratio = rate of successful events (over a period)
	            /
	            rate of total events (over a period)
Using count of events
Success ratio = number of successful events (over a period)
	            /
	            total number of events (over a period)
Both approaches measure the ratio of successful events, and the choice depends on the type of metric in the SLI query.
The following examples illustrate how to define event-based SLIs for different metric types:
Note
Event-based SLIs ensure each event contributes equally to the SLO and error budget.
Grafana expects SLIs to parse as a ratio-like query:
numerator / denominator. SLIs that don’t parse as ratios might produce incomplete dashboard reports.If your data doesn’t expose both success and total events, define recording rules or update your service instrumentation rather than relying on complex SLI workarounds.
Time-based SLIs
Time-based SLIs calculate the value of success for each time slice.
Success ratio =  successful time-slices
                 /
                 total time-slices
The error budget calculation uses the value of successful time slices over total time slices for various time window.
Note
An important drawback of time-based SLIs is that a bad minute during low traffic penalizes the SLO as much as a bad minute during peak traffic, even though fewer users are impacted.
Time-based SLIs are supported using the Advanced SLI option, but they don’t support all Grafana SLO reports and are not recommended.


