SLI example for latency
This guide provides examples of how to define latency SLIs using different Prometheus metric types.
Before you begin, you should decide which latency you want to measure.
Choose the latency metric
Latency can represent different parts of a request’s lifecycle, and the metric you query in your SLI determines what you are measuring and what your SLO represents.

In practice, latency metrics typically fall into two categories: client latency and server latency.
Client-perceived latency (user experience)
Client-perceived latency measures total request duration, including network transit, connection establishment, and other factors between the client and the service.
SLOs are intended to measure user experience. For latency, this usually means measuring end-to-end request duration, using metrics such as:
- Synthetic monitoring probe metrics (for example,
probe_all_duration_seconds) - Real user monitoring metrics
However, client-side latency can be noisy. If you don’t operate the network, DNS, or edge infrastructure, it may be more effective to focus latency SLOs on server-side components.
Server-side latency (service performance)
Server-side latency measures how long the service takes to process a request, excluding network time. These metrics are typically emitted by the application or server.
Server-side latency does not fully capture end-to-end user experience, but it provides a stable and controllable signal that works well for defining latency SLOs. Note that under high traffic, end-to-end latency is primarily impacted by server-side processing rather than network overhead.
Many teams track both: client-side latency to understand user experience, and server-side latency SLIs to define actionable SLOs.
Define the SLI and SLO target
Based on the client-side and server-side latency definitions, you can define SLOs such as the following:
In these examples, the SLI query measures all requests, and the SLO defines the percentage of requests that must meet the latency objective within the specified time window.
When possible, avoid using percentiles in SLIs, such as 95th percentile latency with a 99% target.
- Do: Server requests are processed within 1 second with a 99% target.
- Avoid: 95th percentile server latency is below 1 second with a 99% target.
Avoiding percentiles in SLIs helps maintain simplicity and consistency across SLO types. Refer to Building good SLOs—CRE life lessons from Google Cloud for more on this topic.
SLI query requirements
Before detailing SLI query examples, it’s important to understand what Grafana SLO expects from an SLI:
Grafana recommends using event-based SLIs, which measure the ratio of successful events to total events.
The SLI query result must return a ratio between 0 and 1, where
1means100%of events were successful.Grafana expects SLIs to be expressed as a ratio-like query:
numerator / denominator.
Depending on the type of metric, you can calculate the ratio of successful events using counts or rates:
Success ratio = number of successful events (over a period)
                /
total number of events (over a period)Success ratio = rate of successful events (over a period)
/
rate of total events (over a period)Both formulas produce the ratio of successful events, a value between 0 and 1.
Prometheus classic histogram example
Classic histogram metrics in Prometheus store samples based on their value (latency in this case) and expose additional series:
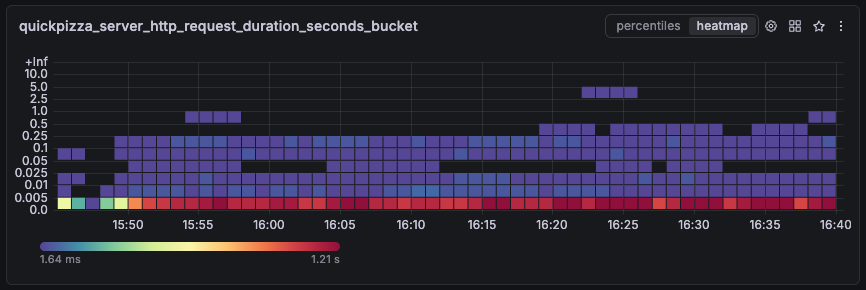
*_count: Returns the total number of observations across all latencies.*_bucket: Returns observations grouped into predefined buckets. For the metric below, the buckets are0,0.005,0.01,0.025,0.05,0.1,0.25,0.5,1,2.5,5,10, and+Inf.![Graph visualizing the different buckets of a classic histogram metric]()
Classic histograms can return the number of observations that fall within a specific, preconfigured bucket. For example, when an SLO requires request latency to remain below a fixed threshold, you can build the SLI query using the additional _bucket and count series:
Success metric:
request_duration_seconds_bucket{le="<BUCKET>"}The number of requests with latency less than or equal to the selected bucket.
Total metric:
request_duration_seconds_countThe total number of observed requests.
Note
Classic histograms cannot accurately estimate observations for thresholds that are not configured as preconfigured buckets.
If your latency threshold is not available as one of the histogram buckets, refer to handle a threshold not available as a bucket for alternative approaches.
With classic histograms, the SLI query should also follow the ratio of successful event rates formula:
Success ratio = rate of successful events (over a period)
                /
rate of total events (over a period)This example uses a different threshold (2.5s) for demonstration purposes. Choose the Advanced option to create the SLI query, which looks like this:
sum(rate(request_duration_seconds_bucket{le="2.5"}[$__rate_interval]))
/
sum(rate(request_duration_seconds_count[$__rate_interval]))Numerator: The success metric, representing the rate of successful events.
rate(request_duration_seconds_bucket{le="2.5"}[$__rate_interval])calculates the per-second rate of requests with latency below2.5seconds.sum (...)aggregates across all dimensions (all label combinations returned by the metric).
Denominator: The total metric, representing the rate of all events.
rate(request_duration_seconds_count[$__rate_interval])calculates the total per-second rate of latency observations (all requests).sum (...)aggregates across all dimensions (all label combinations returned by the metric).
SLI result: A ratio between
0and1, where1means100%of requests were under2.5seconds.
Tip
You can explore an SLO based on this SLI example in Grafana Play.
Use the SLO dashboard to observe the error budget state and SLI value in real time, then click Explore SLI Query to inspect the underlying query.
Handle a threshold not available as a bucket
With classic histograms, it’s common for your preferred SLI threshold to not match an existing histogram bucket, as in this example:
- The SLI searches for responses under
2seconds. - But the available buckets are configured for
1and2.5, not2.
In this case, request_duration_seconds_bucket{le="2"} returns no series, and you should consider other approaches:
- Add a bucket for your threshold: If you control the instrumentation, update the histogram metric to include a bucket for the exact SLI threshold.
- Approximate using the nearest bucket: Use the nearest higher or lower bucket. Document this clearly and adapt your SLO settings, as the SLO no longer match the intended SLI threshold.
Prometheus gauge example
Histograms are recommended for storing high-frequency observations such as request latency. They are designed to efficiently capture large volumes of data and support calculations such as percentiles, ratios, and averages.
However, in some cases, latency may be available only as a gauge metric, for example when relying on third-party data sources or legacy instrumentation.
When working with gauge metrics, define the SLI using the ratio of successful events formula:
Success ratio = number of successful events (over a period)
                /
                total number of events (over a period)
This examples uses a latency threshold of 2 and request_duration_seconds is a gauge metric. The complete SLI query is:
# number of successful requests over the interval
sum(
  count_over_time(
    (request_duration_seconds < 2)[$__interval:]
  )
)
/
# number of total requests over the interval
sum(
  count_over_time(
    request_duration_seconds[$__interval:]
  )
)
Here’s the breakdown of the numerator query:
# number of successful requests over the interval
sum(
  count_over_time(
    (request_duration_seconds < 2)[$__interval:]
  )
)
request_duration_seconds < 2Returns latency samples. The
< 2comparison filters samples where latency is below the SLI threshold (less than two seconds).[$__interval:]Runs the previous expression over the past
$__interval.Because
count_over_timeworks only on range vectors, it uses a subquery[:]to produce a range vector containing all samples from that period.count_over_time(...)Counts the number of samples in the previous query, the number of successful requests in the range vector.Finally,
sum(...)aggregates across all series (dimensions).
The numerator is then divided by the total number of requests over the same interval using a similar query:
/
# number of total requests over the interval
sum(
  count_over_time(
    request_duration_seconds[$__interval:]
  )
)
Note
$__rate_intervalis recommended for calculatingrate()in other examples. When you use other_over_time()functions that don’t require at least two data points, it’s better to use$__intervalto achieve finer error budget resolution by evaluating SLIs at smaller time intervals.
Alternatively, the numerator can use bool and sum_over_time:
# number of successful requests over the interval
# `bool` returns a binary 0/1 series and `sum_over_time` sums 1s for successes
sum(
    sum_over_time(
      (request_duration_seconds < bool 2)[$__interval:]
    )
)
/
# number of total requests over the interval
sum(
  count_over_time(
    request_duration_seconds[$__interval:]
  )
)
Tip
You can explore an SLO based on this SLI example in Grafana Play.
Use the SLO dashboard to observe the error budget state and SLI value in real time, then click Explore SLI Query to inspect the underlying query.


