Configure burn-rate notifications
When an SLO has alert rules enabled, Grafana Alerting generates the corresponding burn-rate alert rules under the Grafana SLO folder.
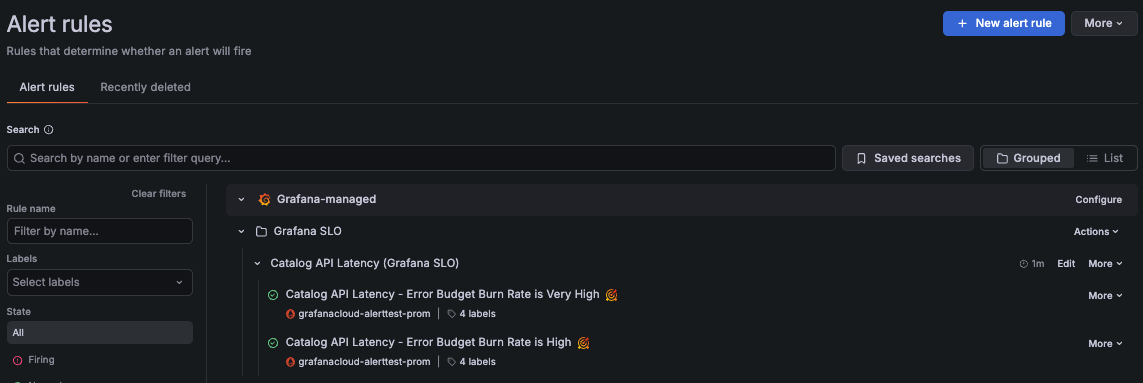
When SLO alert rules are created, a set of labels are automatically added to uniquely identify the alert rules, including grafana_slo_uuid, grafana_slo_window, and grafana_slo_severity labels.
By default, Grafana SLO uses the grafana_slo_severity label to differentiate:
- Fast-burn alerts use
grafana_slo_severity="critical". - Slow-burn alerts use
grafana_slo_severity="warning".
Configure notifications
To configure where to receive SLO alert notifications, complete the following steps in Grafana Alerting:
Configure notification policies to handle SLO alert notifications.
Use the
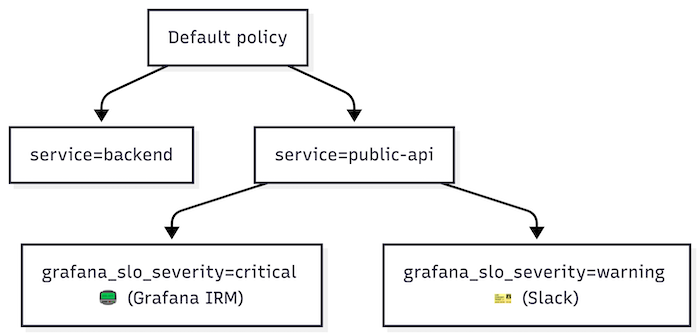
service,team, or other SLO labels to match alert labels in the notification policy. Then use thegrafana_slo_severitylabel to route alerts by severity.A notification policy is often designed to handle related alerts. For instance, you can create a policy to handle all fast-burn alerts for a specific
serviceorteam.Configure a contact point for each notification policy.
Notification policies that handle fast-burn alerts should use a paging system, such as Grafana IRM, because these alerts often require immediate action or team response.
For policies handling slow-burn alerts, use ticketing systems such as Jira or ServiceNow, or send notifications to a team channel.
Below is an example of a basic notification policy tree that handles SLO alerts:
For more details on setting up notifications, refer to Grafana Alerting notifications.
Burn-rate alert rule conditions
Burn-rate (SLO) alerts are based on the error budget burn rate metric, which measures how quickly the service consumes the error budget:
> 1means the service exhausts the error budget before the end of the SLO time window.= 1means the service exhausts the error budget exactly at the end of the SLO time window.< 1means the service does not exhaust the error budget within the SLO time window.
Burn-rate alerts follow practices from the Google SRE workbook.
Fast-burn alerts (grafana_slo_severity="critical") are designed to fire when the error budget would be consumed over minutes or hours. They evaluate shorter time periods and are triggered when:
- The burn rate is at least
14.4×when averaged over the last 5 minutes and the last hour. - The burn rate is at least
6×when averaged over the last 30 minutes and the last 6 hours.
Slow-burn alerts (grafana_slo_severity="warning") are designed to fire when the error budget would be consumed over hours or days. They evaluate longer time periods and are triggered when:
- The burn rate is at least
3×when averaged over the last 2 hours and the last 24 hours. - The burn rate is at least
1×when averaged over the last 6 hours and the last 72 hours.
In Grafana Alerting, you can explore the queries and conditions for each burn-rate alert.


