
Dynatrace data source for Grafana
The Dynatrace data source plugin allows you to query and visualize Dynatrace Metrics, Problems, Audit Logs, Management Zones, Logs and also use USQL from within Grafana. Querying Logs is currently in Beta as the underlying Dynatrace API is an Early Adopter Release.
Requirements
This plugin has the following requirements:
- A Dynatrace account
- One of the following account types:
- Available for users with a Grafana Cloud Free, Advanced or Trial account or with an activated Grafana Enterprise license.
Known limitations
- Template variables cannot be multi-select; only single selection is supported.
- Querying Logs is currently in Beta as the underlying Dynatrace API is an Early Adopter Release.
- Querying Management zones require
Read configurationscope. You can skip this scope, if you don’t want to use management zone filter.
Install the Dynatrace data source plugin
To install the data source, refer to Installation.
Get an API key from Dynatrace
To set up an API token, refer to Dynatrace API - Tokens and authentication.
To query the individual services, you need specific scopes added to your API token.
| Service | Scopes required |
|---|---|
| Metrics | Read metrics, Read entities, (optional : v1: Read configuration ) |
| Problems | v1: Access problem and event feed, metrics, and topology |
| USQL | v1: User sessions |
| Logs | Read logs |
| Audit Logs | Read audit logs |
| Management zones | v1: Read configuration |
| Direct API access | Refer dynatrace API documentation for the scopes required |
Configure the data source in Grafana
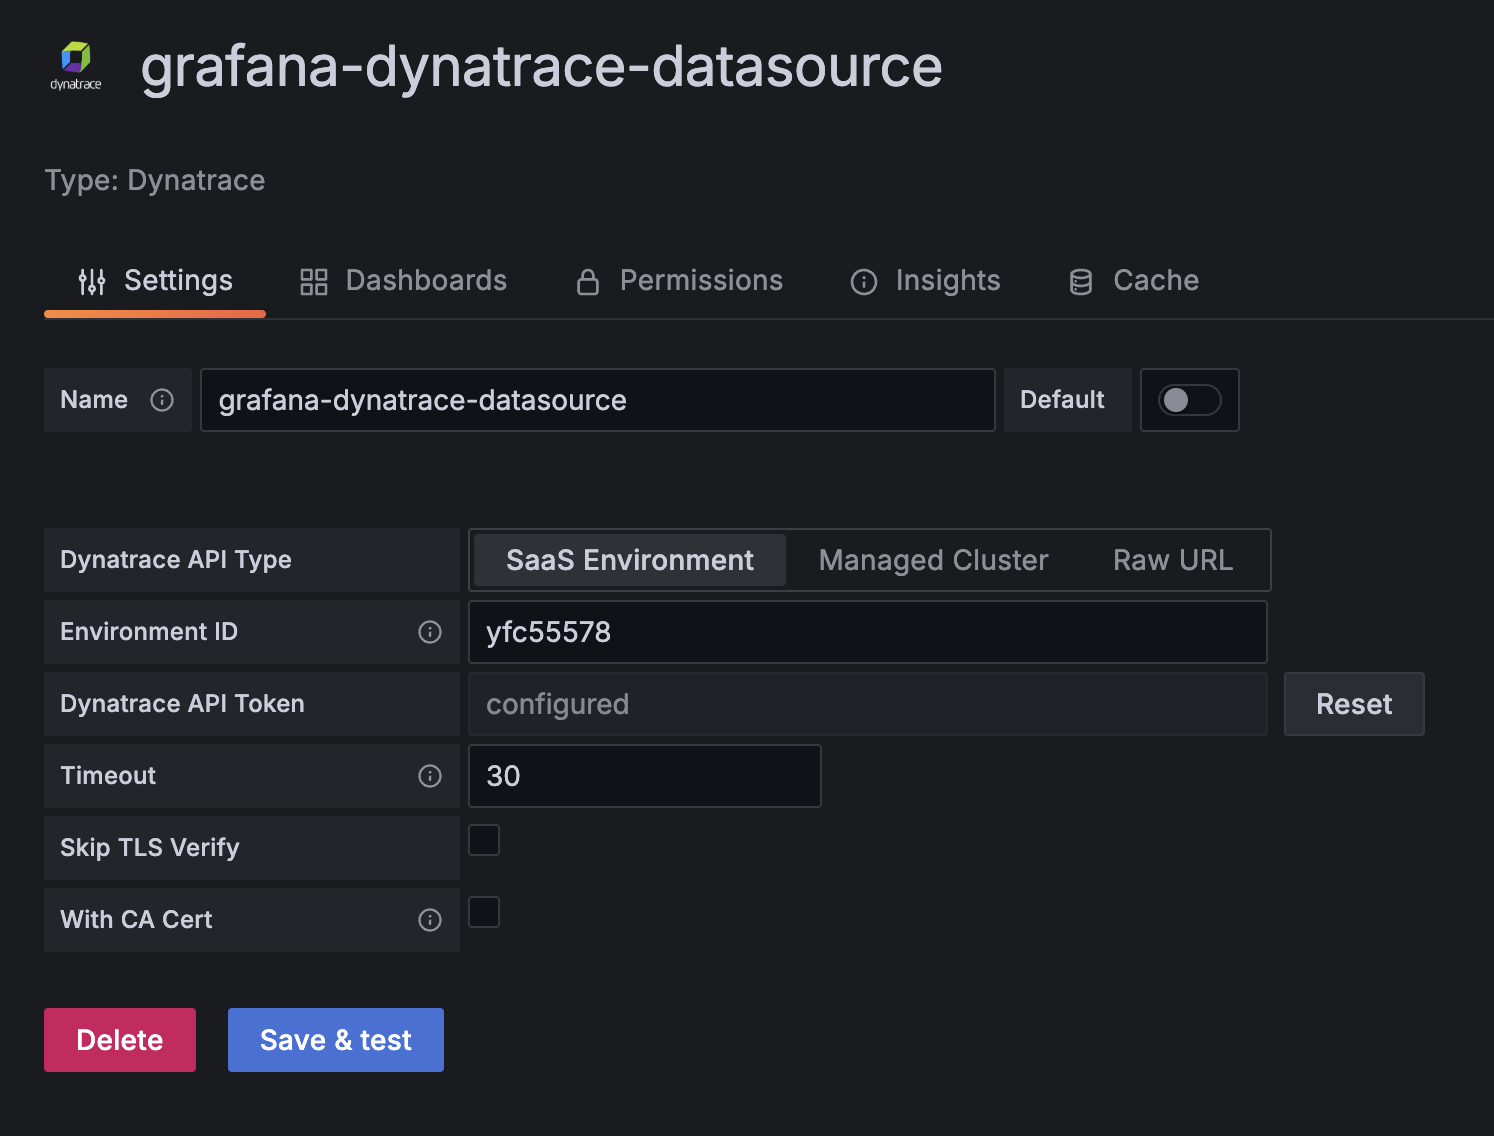
Add a data source by filling in the following fields:
- Name
- The name you want to apply to the Dynatrace data source.
- Dynatrace API Type
- The type of Dynatrace instance that you are connecting to. There are 3 options:
- SaaS
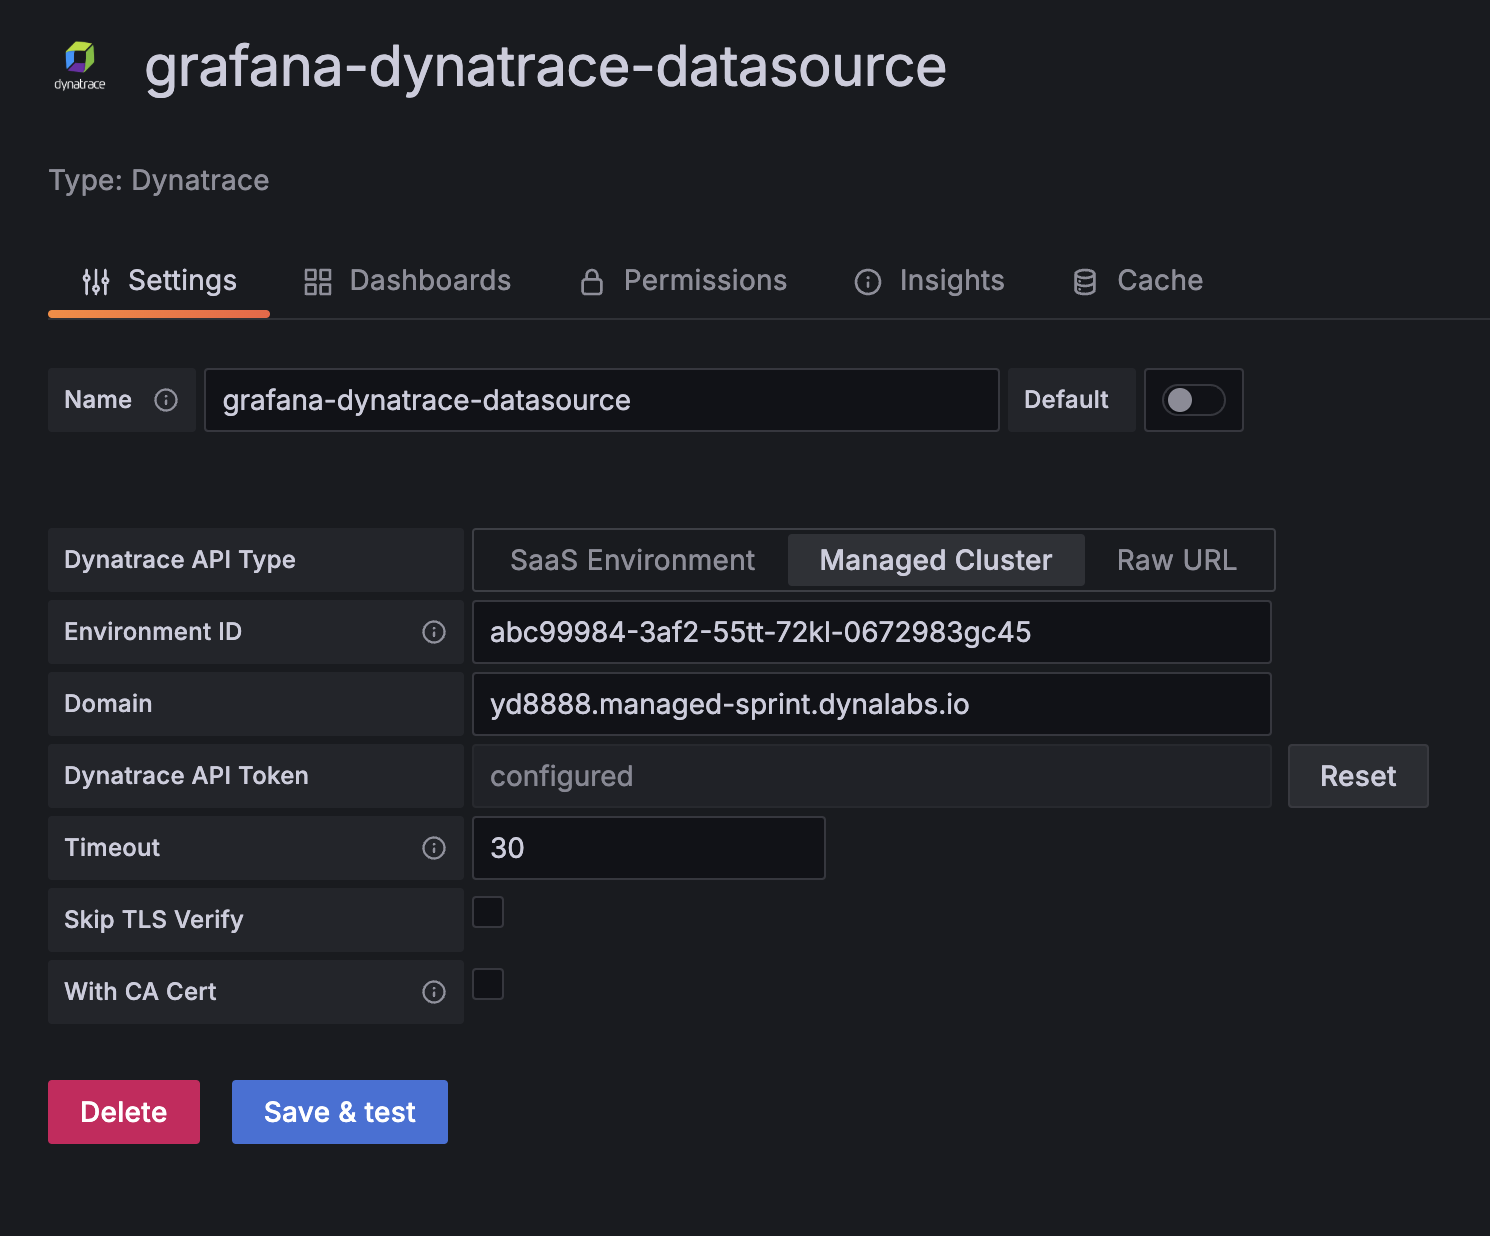
- Managed Cluster
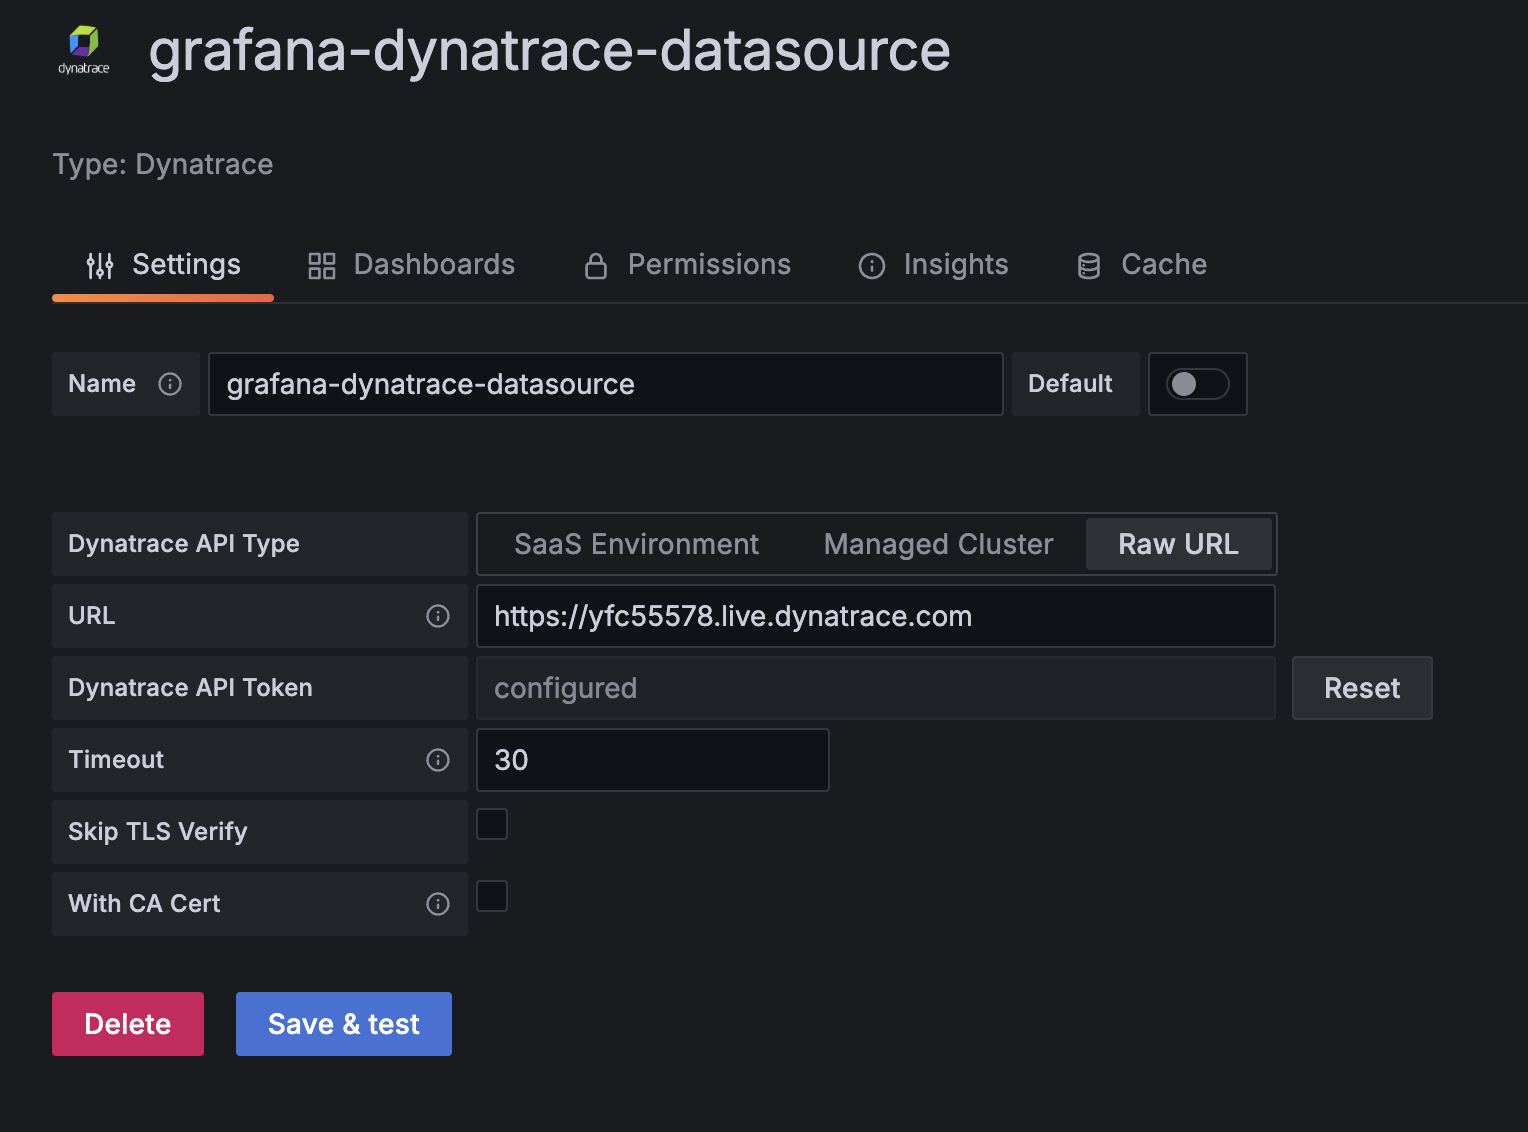
- Raw URL
- Environment ID
- In the SaaS example of
yfc55578.live.dynatrace.com, your Environment ID would beyfc55578. In the Managed example ofyd8888.managed-sprint.dynalabs.io/e/abc99984-3af2-55tt-72kl-0672983gc45, your Environment ID would beabc99984-3af2-55tt-72kl-0672983gc45, and your Domain would beyd8888.managed-sprint.dynalabs.io
- Raw URL
- The URL of your custom dynatrace instance. e.g.
https://yfc55578.live.dynatrace.com. Raw URL allows the entry of a URL to a dynatrace instance that falls outside of eitherSaaSorManaged Cluster.
- Dynatrace API token
- An API token generated with
metrics.readandentities.readpermissions. Refer to Get an API key and application key from Dynatrace. - Skip TLS verify
- optional Enable this option if you required to skip TLS verification. Default value: false
- With CA Cert
- optional Needed for verifying self-signed TLS Certs Default value: false. If enabled, you also need to provide the corresponding certificate in CA Cert section
- Timeout
- Defaults to 30 seconds. Configures the http client timeout between Plugin and Dynatrace.
Configure the data source with provisioning
It is possible to configure data sources using config files with Grafana’s provisioning system. To read more about how configuration works, including all the settings that you can set for data sources, refer to Provisioning Grafana.
apiVersion: 1
datasources:
  - name: Dynatrace
    type: grafana-dynatrace-datasource
    jsonData:
      apiType: saas
      environmentId: environment Id
    secureJsonData:
      apiToken: API token
  - name: Dynatrace Managed
    type: grafana-dynatrace-datasource
    jsonData:
      apiType: managed
      environmentId: environment Id # example: abc99984-3af2-55tt-72kl-0672983gc45
      domain: domain # example: yd8888.managed-sprint.dynalabs.io
      tlsSkipVerify: false
      tlsAuthWithCACert: true
      httpClientTimeout: 360
    secureJsonData:
      apiToken: API token
      tlsCACert: |
        -----BEGIN CERTIFICATE-----
        1221323123213123231231232+g6DAzj/11231
        sdsaas==
        -----END CERTIFICATE-----
Import a dashboard for Dynatrace
To import a dashboard, refer to Importing a dashboard. Imported dashboards can be found in Configuration > Data Sources > select your Dynatrace data source > select the Dashboards tab to see available pre-made dashboards.
Get the most out of the plugin
- Add Annotations.
- Configure and use Templates and variables.
- Add Transformations.
- Set up alerting; refer to Alerts overview.
Was this page helpful?
Related resources from Grafana Labs


