
Get started with Grafana Assistant
Warning
Grafana Assistant is currently in Public Preview. This feature is subject to change without warning.
This article shows you how to set up Grafana Assistant in your Grafana Cloud organization, get started using its core capabilities, and explore next steps for maximizing your observability workflow.
Grafana Assistant is an AI-powered observability agent built into Grafana Cloud that helps you monitor, troubleshoot, and manage your systems through natural language conversations. Instead of learning complex query languages or memorizing dashboard locations, you can ask simple questions like “Show me CPU usage” or “Create a dashboard for my database.”
The Assistant understands your observability data across metrics, logs, traces, profiles, and databases, making it easier to gain insights and solve problems without requiring deep technical expertise in each tool.
What Grafana Assistant can do
Grafana Assistant acts as your observability expert, helping you work more effectively with your monitoring data through five core capabilities:
- Data analysis and querying: Ask questions about your system’s performance, errors, and behavior using plain English. The Assistant translates your questions into proper queries and analyzes results across multiple data types.
- Dashboard management: Create new monitoring dashboards or modify existing ones without needing to know visualization best practices or complex configurations.
- Query assistance: Build and refine queries for different monitoring tools, for example, Prometheus for metrics or Loki for logs, with automatic syntax validation and performance optimization.
- Navigation and discovery: Find relevant dashboards, data sources, and monitoring resources using semantic search instead of browsing through long lists.
- Knowledge and guidance: Get answers about Grafana features, observability concepts, and monitoring best practices without searching through documentation.
Prerequisites
Before you begin, ensure you have the following:
- Grafana Cloud account: Grafana Assistant is exclusively available in Grafana Cloud, which is Grafana’s hosted observability platform. If you don’t have an account, you can sign up at grafana.com.
- Administrator access: You need administrator permissions to enable Grafana Assistant for your organization. This is a one-time setup that makes the Assistant available to all users.
- Data sources (recommended): While not required to get started, the Assistant works best when you have monitoring data configured in your Grafana Cloud instance. Supported data sources include:
- Prometheus: Collects and stores metrics such as response times, CPU usage, memory consumption, and request rates from your applications and infrastructure
- Loki: Aggregates and searches logs such as application error messages, access logs, system events, and debugging information
- Tempo: Traces requests across distributed systems to identify bottlenecks, latency issues, and service dependencies in microservices architectures
- Pyroscope: Profiles application performance continuously to identify memory leaks, CPU hotspots, and inefficient code paths
- k6: Performance testing results including load test metrics, user simulation data, and API response benchmarks
- SQL databases: Business and operational data from PostgreSQL, MySQL, ClickHouse, BigQuery, and more for correlating metrics with business outcomes
- On-premise data sources available through Grafana Cloud connections
Enable Grafana Assistant
An administrator must accept the terms and conditions to enable Grafana Assistant for your organization:
- Sign in to Grafana Cloud as an administrator.
- Navigate to Administration > Plugins and data > Plugins.
- Search for Grafana Assistant or go directly to
/plugins/grafana-assistant-app. - Review the terms and conditions.
- Check the agreement box.
- Click Save.
After you enable the Assistant, the sparkle icon appears in the top-right corner of Grafana for all users in your organization.
Try the tutorial
Grafana Assistant includes an interactive tutorial that guides you through the main features and capabilities. The tutorial is designed to help you get hands-on experience with the Assistant’s most important workflows.
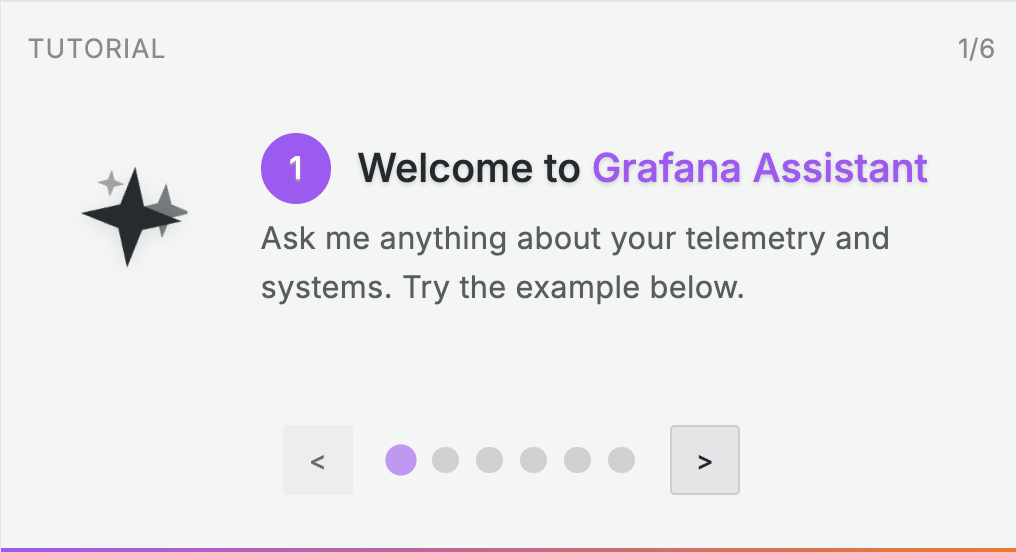
When you first open Grafana Assistant, you’ll see the tutorial option. The tutorial takes you on a journey through:
- Asking questions about your observability data
- Creating and modifying dashboards
- Building queries across different data sources
- Using mentions to get more specific results
- Navigating your Grafana resources
The tutorial is interactive, meaning you’ll practice each feature directly within the Assistant interface. You can complete the entire tutorial in one session or return to it later. To access the tutorial at any time, click the three-dot menu in the Assistant chat and select Open tutorial.
Start your first conversation
To open Grafana Assistant, click the sparkle icon in the top-right corner of your Grafana Cloud interface or select Assistant from the left navigation menu. This opens a chat interface where you can ask questions using natural language.
The Assistant works best when you’re specific about what you want to achieve. Think of it as talking to a monitoring expert who has access to all your data but needs context about what you’re trying to accomplish.
Your first query
Start with a simple question to explore your data. For example:
Show me CPU usage for the API serviceWhen you ask this question, several things happen automatically:
- Data source detection: The Assistant identifies which of your configured data sources contain CPU metrics.
- Query generation: It creates the appropriate queries, for example, PromQL for Prometheus data.
- Multi-signal analysis: It correlates CPU metrics with related logs, traces, and other data to provide context.
- Visualization: It presents the results in charts, graphs, or tables as appropriate.
- Insights: It highlights patterns, anomalies, or trends in the data.
This process demonstrates the Assistant’s core strength: turning complex observability tasks into simple conversations.
Try different types of requests
Once you’re comfortable with basic queries, explore the Assistant’s other capabilities:
- Dashboard creation: “Create a dashboard for monitoring my database performance”
- Query building: “Help me build a query to find all error logs from the last hour”
- Navigation: “Show me dashboards related to Kubernetes monitoring”
- Troubleshooting: “Why is my application responding slowly?”
- Knowledge: “How do I set up alerting for high memory usage?”
Each request type uses the Assistant’s different capabilities, from analyzing your specific data to providing general observability guidance.
Use mentions for better results
The @ mention feature helps the Assistant provide more targeted and accurate responses by adding specific context to your questions. This feature is particularly useful when you have multiple data sources or when you want to focus on specific resources.
To use mentions, type @ in your message or click the @ icon in the chat interface. This opens a menu where you can select from:
- Data sources: Specific monitoring tools like your Prometheus instance, Loki logs, or Tempo traces
- Dashboards and panels: Existing visualizations you want to reference or modify
- Other Grafana resources: Folders, alerts, or other configured items
Example: Generic vs. specific questions
Instead of asking a generic question like:
Show me error ratesUse mentions to be specific:
Show me error rates from @my-application-logsThe specific version helps the Assistant understand exactly which data source to query, what format to expect, and what context to provide in the response. This results in faster, more accurate answers tailored to your specific setup.
Provide feedback to improve the Assistant
Grafana Assistant learns and improves through user feedback. Refer to the privacy and security documentation to learn about how Grafana Assistant works with your data. After each response, you’ll see thumbs up and thumbs down icons that help train the AI to provide better answers.
When to use thumbs up:
- The response accurately answered your question
- The generated queries or dashboards work as expected
- The explanation was clear and helpful
- The Assistant found the right resources or data
When to use thumbs down:
- The response was inaccurate or incomplete
- Generated queries had errors or didn’t work
- The Assistant misunderstood your question
- The information provided wasn’t relevant to your needs
When you give a thumbs down, you can often provide additional context about what went wrong. This specific feedback is especially valuable for improving the Assistant’s performance.
Your feedback directly contributes to making Grafana Assistant more effective for you and other users in your organization.
Next steps
Now that you have Grafana Assistant enabled and understand the basics, here are some ways to get the most value from your observability setup:
Immediate actions:
- Start with simple queries about your most important systems or applications
- Ask for a tour of your existing dashboards: “What dashboards do we have for database monitoring?”
- Identify gaps: “What metrics should we be monitoring for our web application?”
Build your skills gradually:
- Break down complex investigations into smaller questions, for example, “Show me error rates” followed by “What’s causing these errors?”
- Experiment with different question formats to see how the Assistant interprets your needs
- Use the Assistant as a learning tool by asking “How do I…” questions about observability concepts
Explore advanced capabilities:
- Learn about all available features and specialized investigation types
- Read the prompting guide for advanced techniques such as providing context effectively
- Review frequently asked questions for solutions to common scenarios
- Check usage and limits to understand current capabilities and plan accordingly
Remember: Grafana Assistant is designed to grow with your needs. Start simple, learn what works for your environment, and gradually explore more sophisticated monitoring and troubleshooting workflows.
Was this page helpful?
Related resources from Grafana Labs


