
Configure the Amazon CloudWatch data source
This document provides instructions for configuring the Amazon CloudWatch data source and explains available configuration options. For general information on adding and managing data sources, refer to Data source management.
Before you begin
You must have the
Organization administratorrole to configure the CloudWatch data source. Organization administrators can also configure the data source via YAML with the Grafana provisioning system.Grafana comes with a built-in CloudWatch data source plugin, so you do not need to install a plugin.
Familiarize yourself with your CloudWatch security configuration and gather any necessary security certificates, client certificates, and client keys.
Add the CloudWatch data source
Complete the following steps to set up a new CloudWatch data source:
- Click Connections in the left-side menu.
- Click Add new connection
- Type
CloudWatchin the search bar. - Select the CloudWatch data source.
- Click Add new data source in the upper right.
Grafana takes you to the Settings tab, where you will set up your CloudWatch configuration.
Configure the data source in the UI
The following are configuration options for the CloudWatch data source.
Grafana plugin requests to AWS are made on behalf of an AWS Identity and Access Management (IAM) role or IAM user. The IAM user or IAM role must have the associated policies to perform certain API actions.
For authentication options and configuration details, refer to AWS authentication.
Access & secret key:
You must use both an access key ID and a secret access key to authenticate.
Assume Role:
Additional Settings:
CloudWatch Logs:
Application Signals trace link:
Grafana automatically creates a link to a trace in Application Signals data source if logs contain the @xrayTraceId field. To use this feature, you must already have an Application Signals data source configured. For details, see the Application Signals data source docs. To view the link to Application Signals, select the log row in either the Explore view or dashboard Logs panel to view the log details section.
To log the @xrayTraceId, refer to the AWS Application Signals documentation. To provide the field to Grafana, your log queries must also contain the @xrayTraceId field, for example by using the query fields @message, @xrayTraceId.
Private data source connect - Only for Grafana Cloud users.
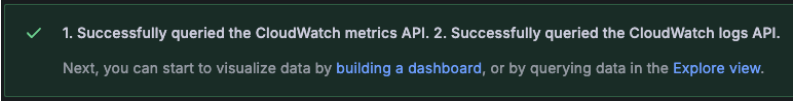
After configuring your Amazon CloudWatch data source options, click Save & test at the bottom to test the connection. You should see a confirmation dialog box that says:
Note
To troubleshoot issues while setting up the CloudWatch data source, check the
/var/log/grafana/grafana.logfile.
IAM policy examples
To read CloudWatch metrics and EC2 tags, instances, regions, and alarms, you must grant Grafana permissions via IAM. You can attach these permissions to the IAM role or IAM user you configured in AWS authentication.
Metrics-only permissions:
{
  "Version": "2012-10-17",
  "Statement": [
    {
      "Sid": "AllowReadingMetricsFromCloudWatch",
      "Effect": "Allow",
      "Action": [
        "cloudwatch:DescribeAlarmsForMetric",
        "cloudwatch:DescribeAlarmHistory",
        "cloudwatch:DescribeAlarms",
        "cloudwatch:ListMetrics",
        "cloudwatch:GetMetricData",
        "cloudwatch:GetInsightRuleReport"
      ],
      "Resource": "*"
    },
    {
      "Sid": "AllowReadingTagsInstancesRegionsFromEC2",
      "Effect": "Allow",
      "Action": ["ec2:DescribeTags", "ec2:DescribeInstances", "ec2:DescribeRegions"],
      "Resource": "*"
    },
    {
      "Sid": "AllowReadingResourcesForTags",
      "Effect": "Allow",
      "Action": "tag:GetResources",
      "Resource": "*"
    },
    {
      "Sid": "AllowReadingResourceMetricsFromPerformanceInsights",
      "Effect": "Allow",
      "Action": "pi:GetResourceMetrics",
      "Resource": "*"
    }
  ]
}
Logs-only permissions:
{
  "Version": "2012-10-17",
  "Statement": [
    {
      "Sid": "AllowReadingLogsFromCloudWatch",
      "Effect": "Allow",
      "Action": [
        "logs:DescribeLogGroups",
        "logs:GetLogGroupFields",
        "logs:StartQuery",
        "logs:StopQuery",
        "logs:GetQueryResults",
        "logs:GetLogEvents"
      ],
      "Resource": "*"
    },
    {
      "Sid": "AllowReadingTagsInstancesRegionsFromEC2",
      "Effect": "Allow",
      "Action": ["ec2:DescribeTags", "ec2:DescribeInstances", "ec2:DescribeRegions"],
      "Resource": "*"
    },
    {
      "Sid": "AllowReadingResourcesForTags",
      "Effect": "Allow",
      "Action": "tag:GetResources",
      "Resource": "*"
    }
  ]
}
Metrics and logs permissions:
{
  "Version": "2012-10-17",
  "Statement": [
    {
      "Sid": "AllowReadingMetricsFromCloudWatch",
      "Effect": "Allow",
      "Action": [
        "cloudwatch:DescribeAlarmsForMetric",
        "cloudwatch:DescribeAlarmHistory",
        "cloudwatch:DescribeAlarms",
        "cloudwatch:ListMetrics",
        "cloudwatch:GetMetricData",
        "cloudwatch:GetInsightRuleReport"
      ],
      "Resource": "*"
    },
    {
      "Sid": "AllowReadingResourceMetricsFromPerformanceInsights",
      "Effect": "Allow",
      "Action": "pi:GetResourceMetrics",
      "Resource": "*"
    },
    {
      "Sid": "AllowReadingLogsFromCloudWatch",
      "Effect": "Allow",
      "Action": [
        "logs:DescribeLogGroups",
        "logs:GetLogGroupFields",
        "logs:StartQuery",
        "logs:StopQuery",
        "logs:GetQueryResults",
        "logs:GetLogEvents"
      ],
      "Resource": "*"
    },
    {
      "Sid": "AllowReadingTagsInstancesRegionsFromEC2",
      "Effect": "Allow",
      "Action": ["ec2:DescribeTags", "ec2:DescribeInstances", "ec2:DescribeRegions"],
      "Resource": "*"
    },
    {
      "Sid": "AllowReadingResourcesForTags",
      "Effect": "Allow",
      "Action": "tag:GetResources",
      "Resource": "*"
    }
  ]
}
Cross-account observability permissions
{
  "Version": "2012-10-17",
  "Statement": [
    {
      "Action": ["oam:ListSinks", "oam:ListAttachedLinks"],
      "Effect": "Allow",
      "Resource": "*"
    }
  ]
}
Note
Cross-account observability lets you retrieve metrics and logs across different accounts in a single region, but you can’t query EC2 Instance Attributes across accounts because those come from the EC2 API and not the CloudWatch API.
For more information on configuring authentication, refer to Configure AWS authentication.
Configure the data source with grafana.ini
The Grafana configuration file includes an AWS section where you can configure data source options:
Provision the data source
You can define and configure the data source in YAML files as part of the Grafana provisioning system. For more information about provisioning and available configuration options, refer to Provision Grafana.
Using AWS SDK (default):
apiVersion: 1
datasources:
  - name: CloudWatch
    type: cloudwatch
    jsonData:
      authType: default
      defaultRegion: eu-west-2
Using credentials’ profile name (non-default):
apiVersion: 1

datasources:
  - name: CloudWatch
    type: cloudwatch
    jsonData:
      authType: credentials
      defaultRegion: eu-west-2
      customMetricsNamespaces: 'CWAgent,CustomNameSpace'
      profile: secondary
Using accessKey and secretKey:
apiVersion: 1

datasources:
  - name: CloudWatch
    type: cloudwatch
    jsonData:
      authType: keys
      defaultRegion: eu-west-2
    secureJsonData:
      accessKey: '<your access key>'
      secretKey: '<your secret key>'
Using AWS SDK Default and ARN of IAM Role to Assume:
apiVersion: 1
datasources:
  - name: CloudWatch
    type: cloudwatch
    jsonData:
      authType: default
      assumeRoleArn: arn:aws:iam::123456789012:root
      defaultRegion: eu-west-2

