Menu
Open source
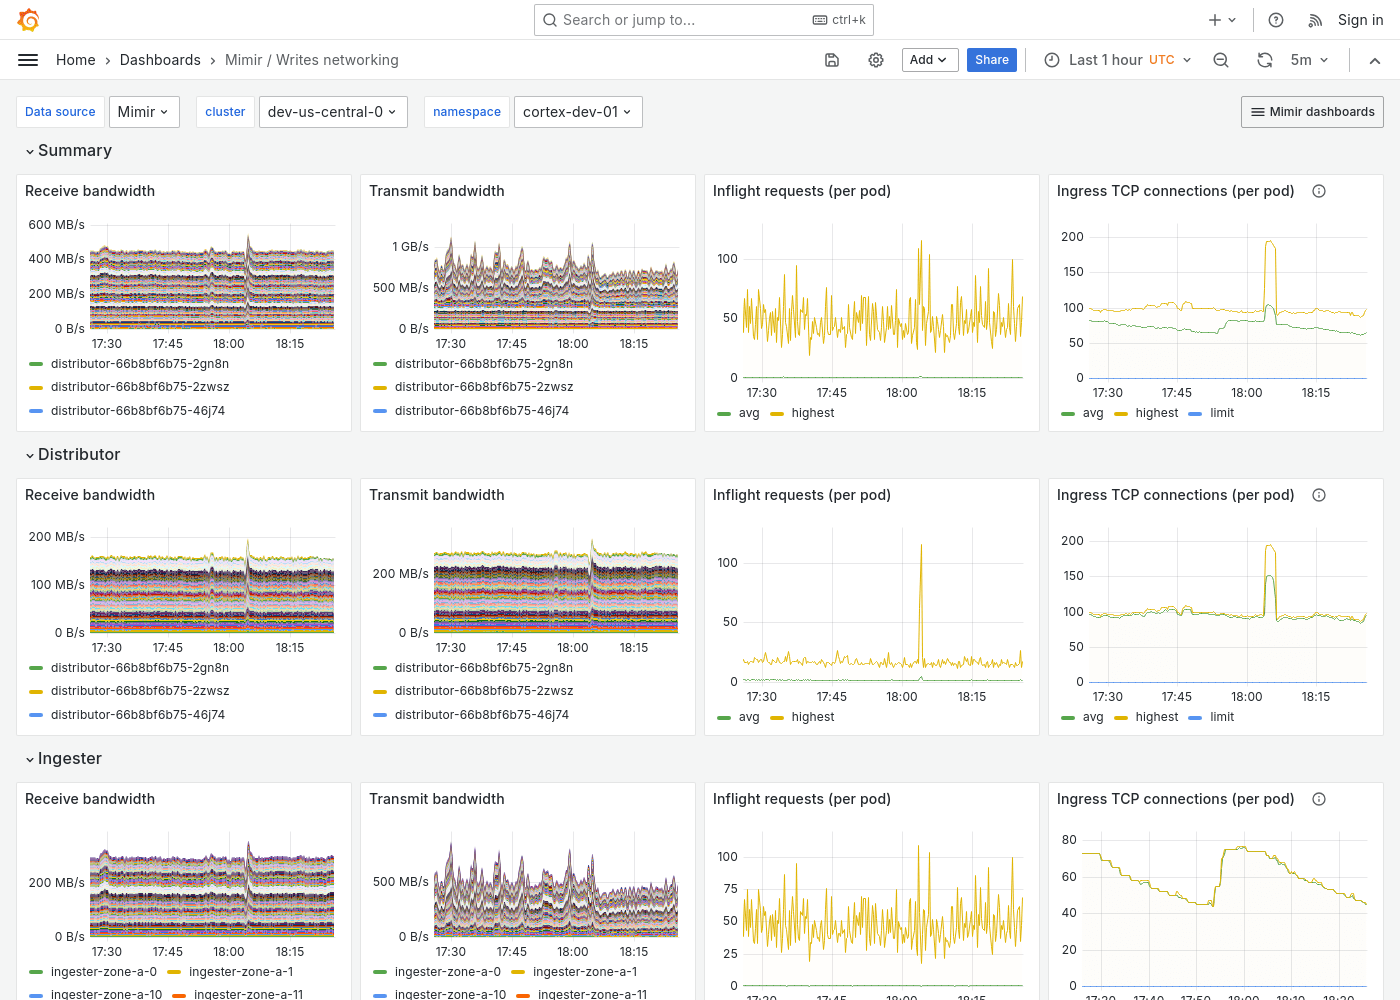
Grafana Mimir Writes networking dashboard
The Writes networking dashboard shows receive/transmit bandwidth, inflight requests, and TCP connections. The dashboard isolates each service on the write path into its own section and displays the order in which a write request flows.
This dashboard requires additional resources metrics.
Use this dashboard for the following use cases:
- Monitor the network performance of the write path within a Mimir cluster.
- Identify where in the write path network delays or congestion are occurring.
- Diagnose networking bottlenecks in the write path.
Example
The following example shows a Writes networking dashboard from a demo cluster.