Menu
Open source
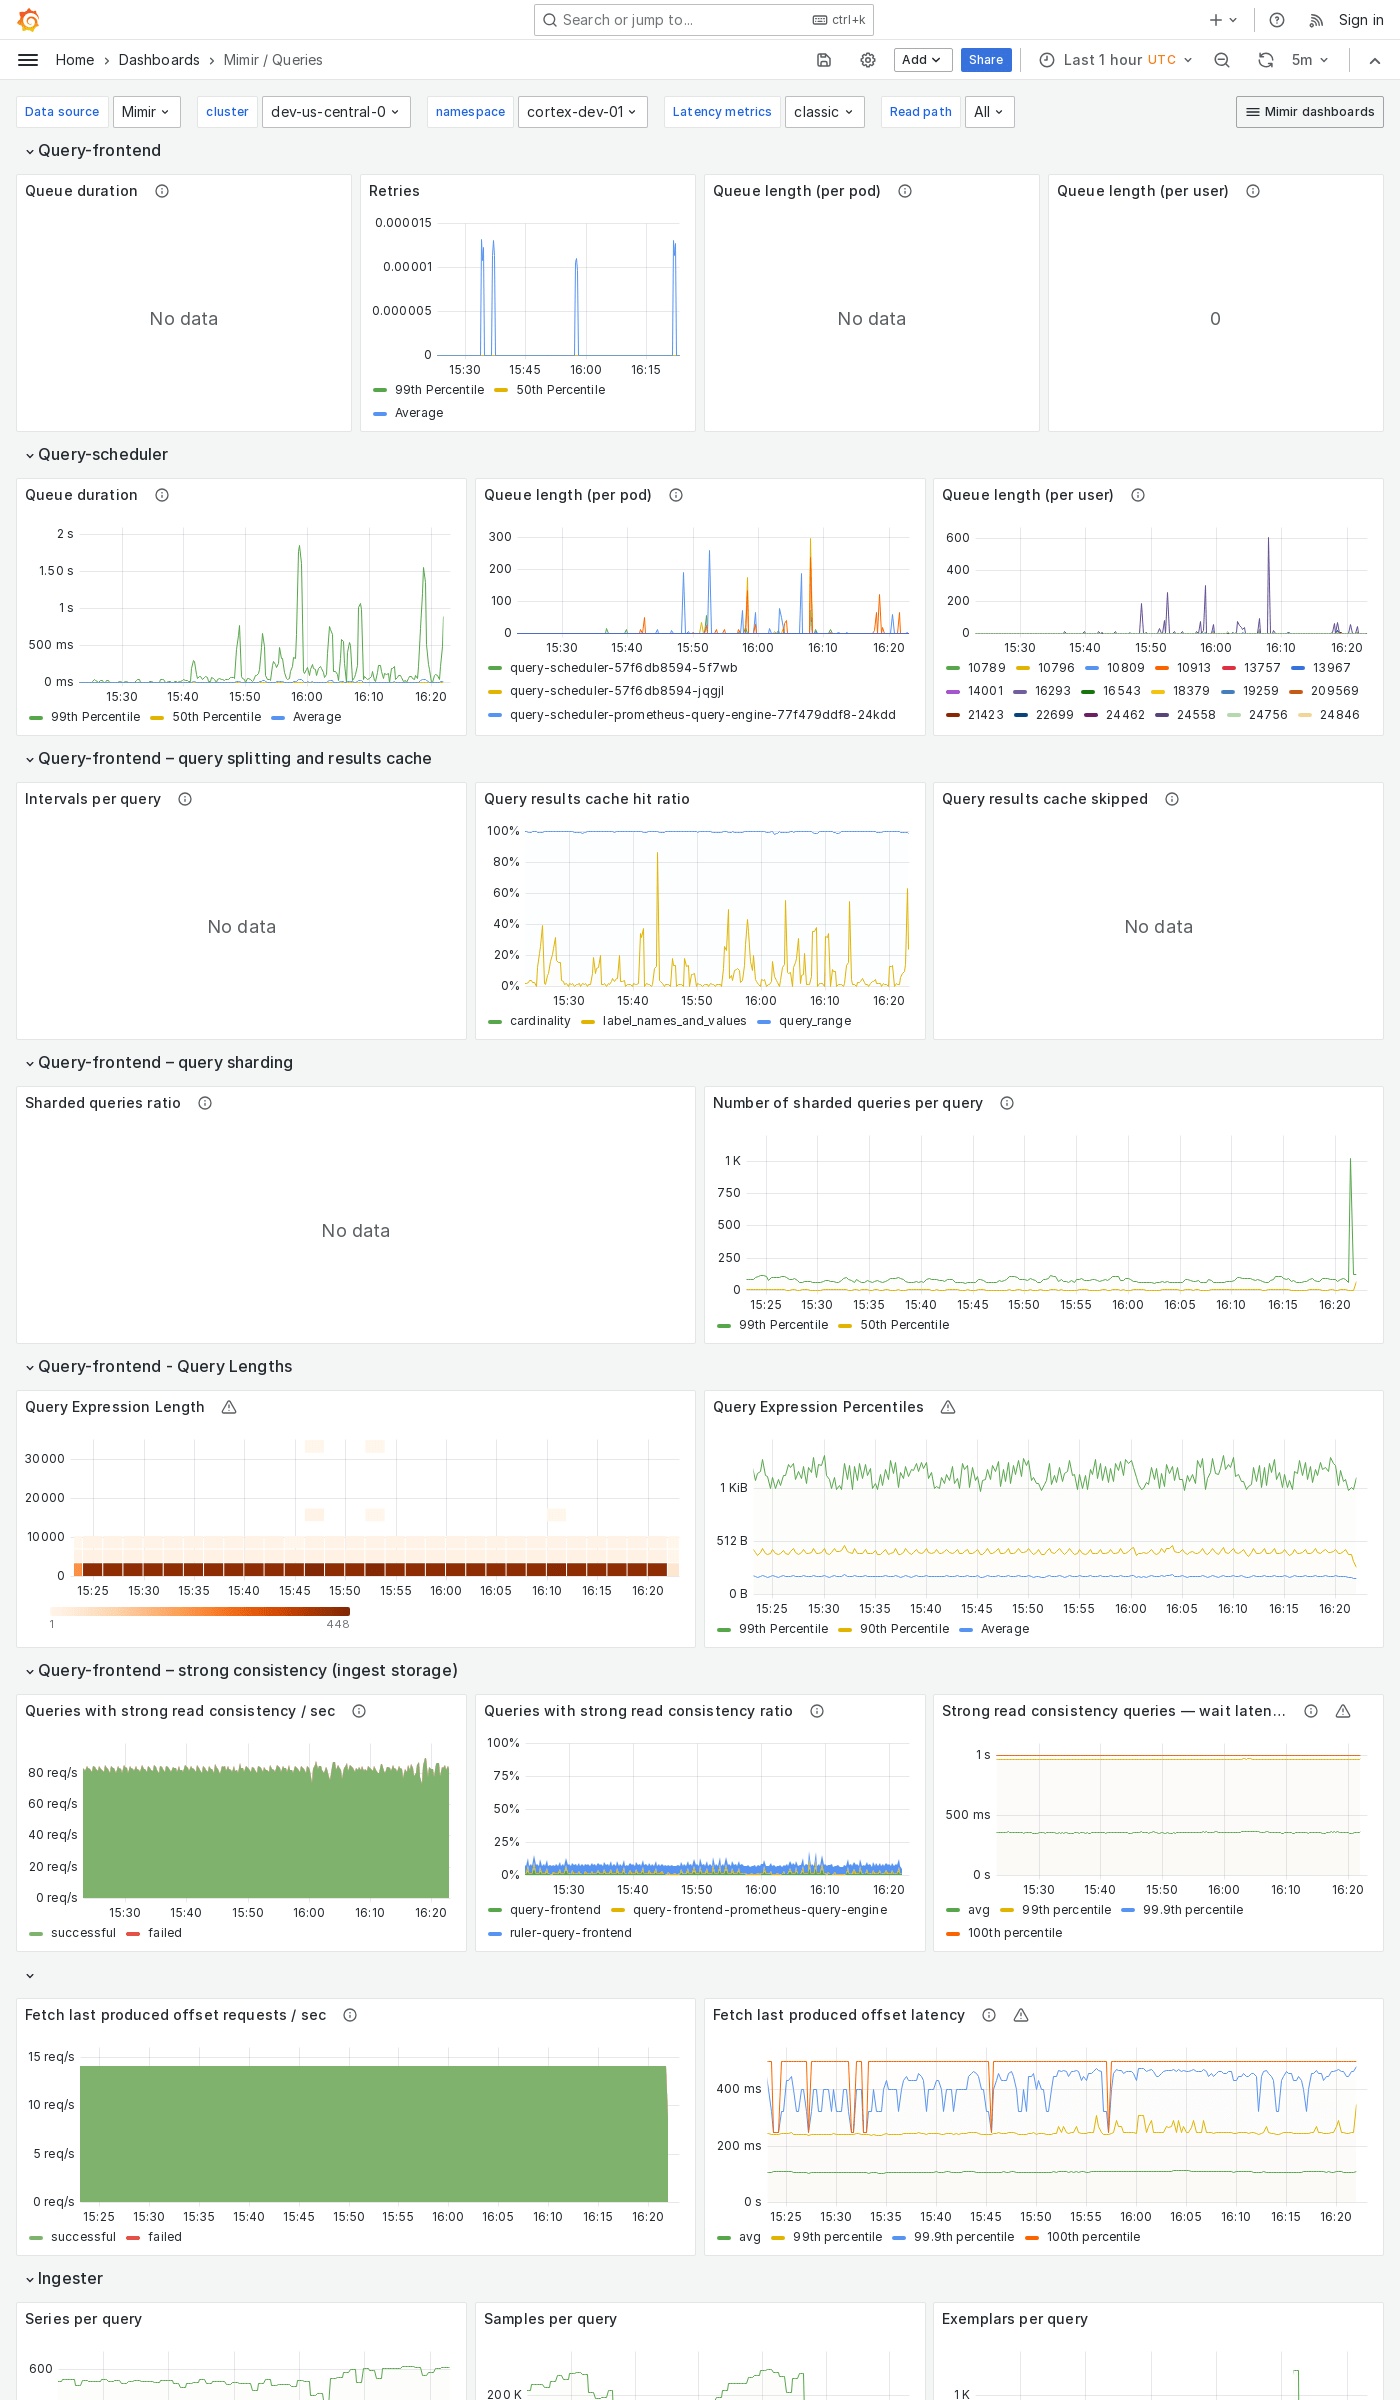
Grafana Mimir Queries dashboard
The Queries dashboard shows information about query queues, duration, retries, and details about query execution performance.
Use this dashboard for the following use cases:
- Observe the length and behavior of query queues to detect potential backlogs or delays.
- Analyze query durations and retries to identify slow or failing queries.
- Fine-tune query parameters, caching strategies, or resource allocations for improved performance.
Example
The following example shows a Queries dashboard from a demo cluster.