Menu
Open source
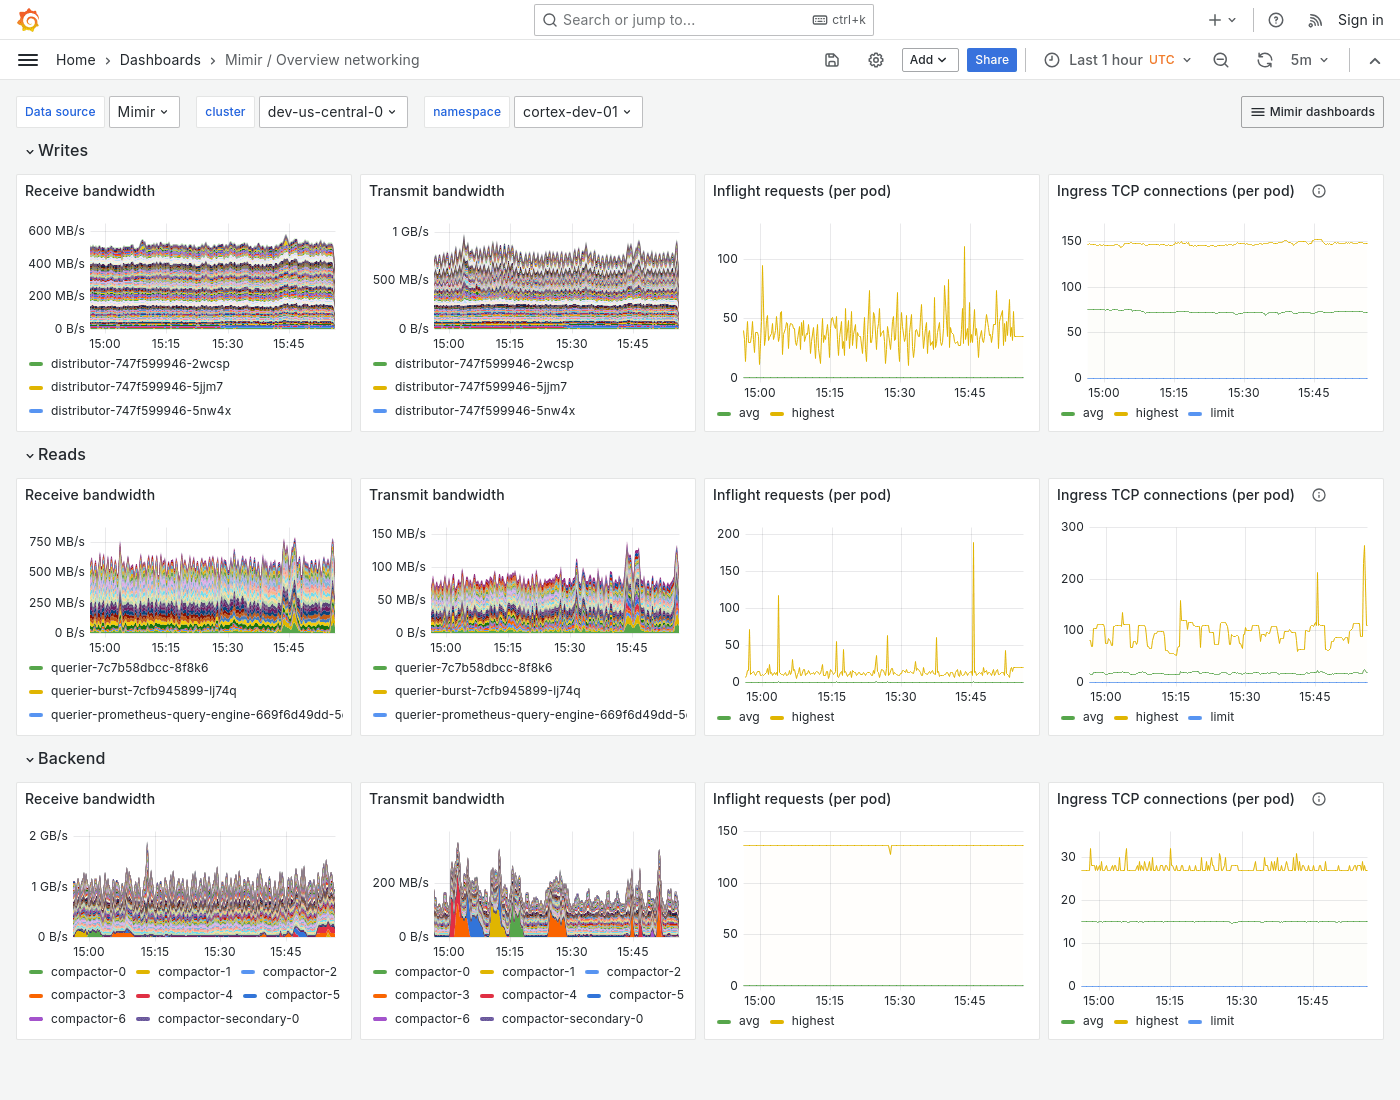
Grafana Mimir Overview networking dashboard
The Overview networking dashboard shows receive and transmit bandwidth, in-flight requests, and TCP connections. The dashboard groups Mimir components into “Writes”, “Reads”, and “Backend”.
Use this dashboard for the following use cases:
- Ensure that the network communication between components is performing optimally.
- Monitor sudden changes in network traffic or an increase in in-flight requests that could indicate potential issues that you need to address.
- Monitor TCP connections to identify potential bottlenecks or connection issues that could affect data ingestion and query performance.
This dashboard requires additional resources metrics.
Example
The following example shows a Overview networking dashboard from a demo cluster.