
About Windows integration pre-built dashboards
The Windows integration provides a variety of pre-built dashboards that you can use right away to begin troubleshooting issues. In this step of the journey, you’ll become familiar with these pre-built dashboards and learn how to use them to address various problems.
Did you know?
If you don’t see any logs or metrics, try switching the data source using the drop-down at the top of the dashboard.
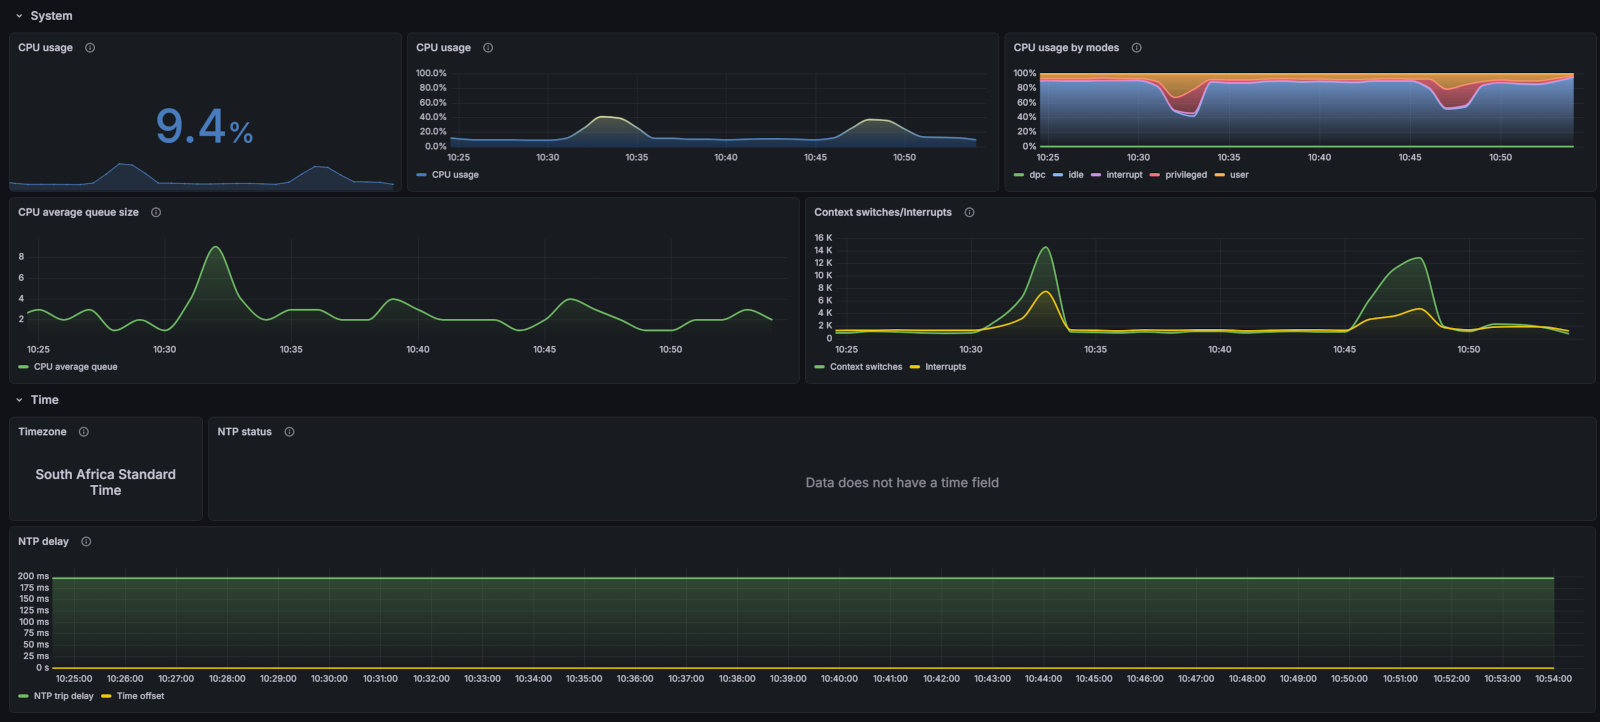
This dashboard offers detailed insights into processor and system-level performance.
Use this dashboard to:
- Drill down into per-core CPU usage.
- Monitor system load averages and context switches.
- Analyze processor queue lengths to identify bottlenecks.
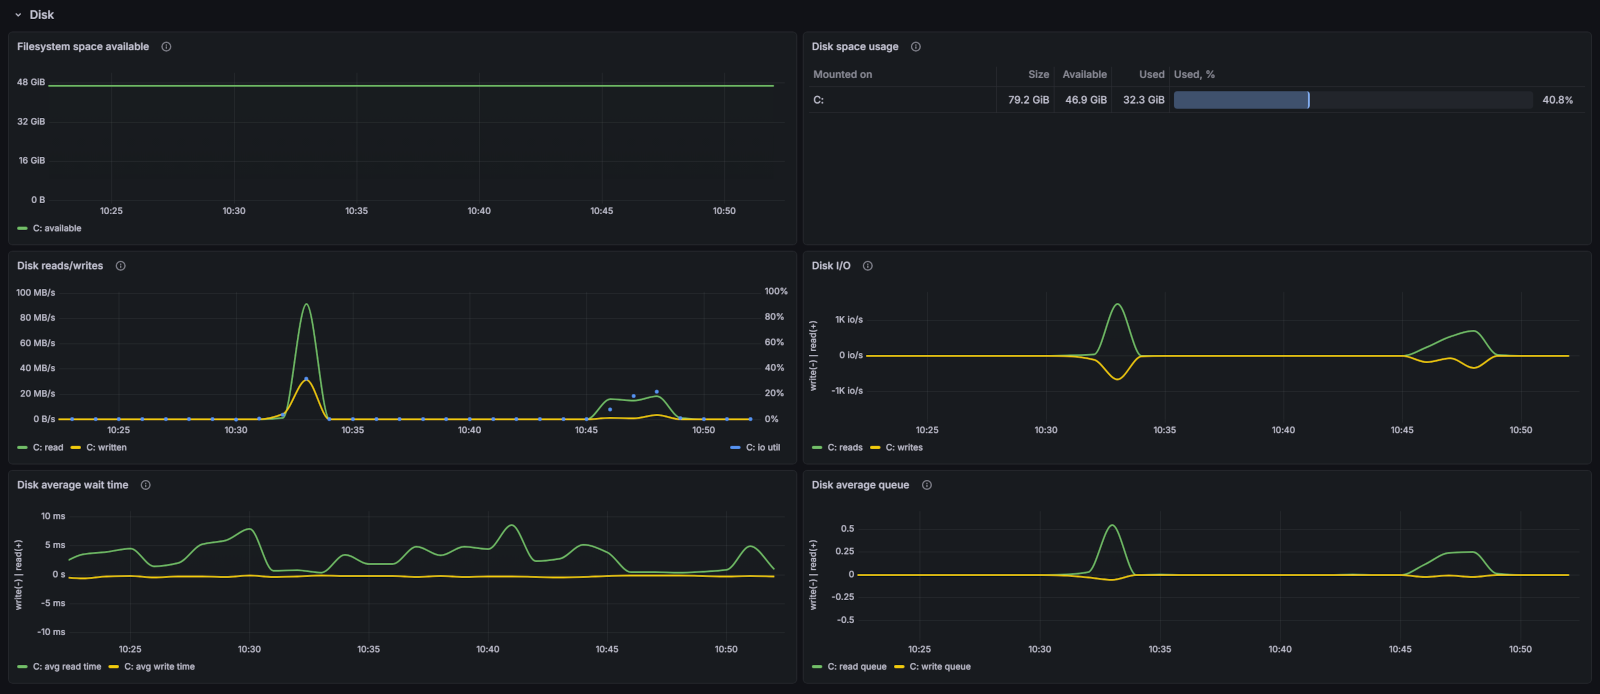
This dashboard provides in-depth metrics for storage devices and logical volumes.
Use this dashboard to:
- Monitor individual disk I/O latency and throughput.
- Track filesystem usage and free space trends.
- Identify disk performance issues or saturation.
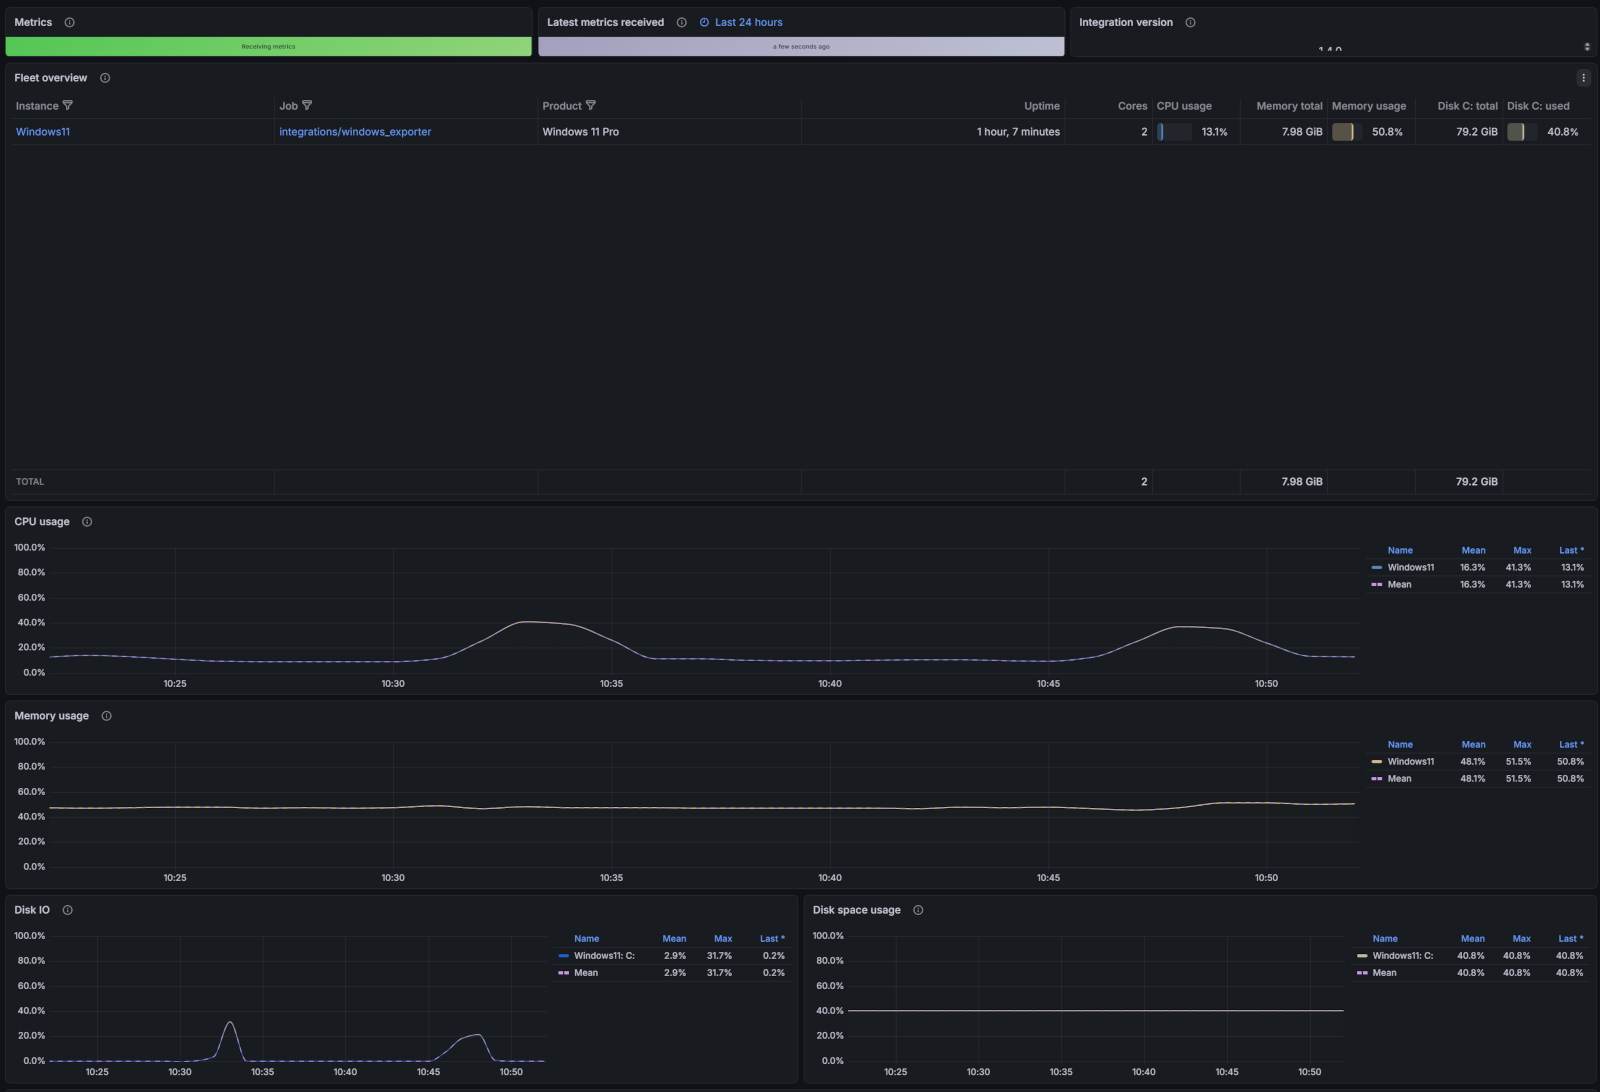
This dashboard is designed for monitoring multiple Windows nodes simultaneously.
Use this dashboard to:
- Compare performance metrics across different Windows servers.
- Identify outliers or nodes experiencing issues.
- Get a consolidated view of your entire Windows infrastructure.
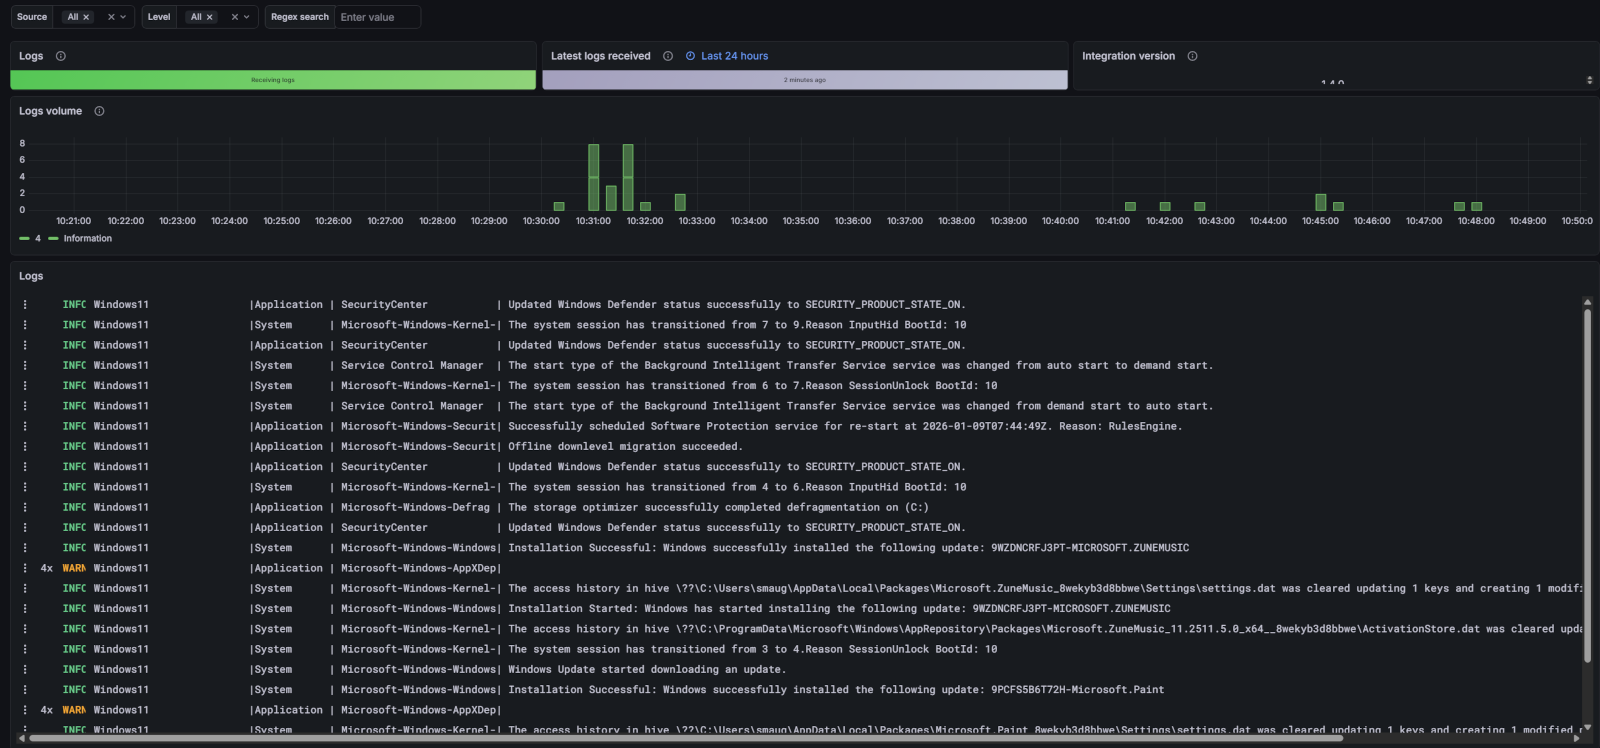
This dashboard visualizes Windows Event Logs collected by Grafana Alloy.
Use this dashboard to:
- Analyze system, application, and security logs.
- Search for specific event IDs or error messages.
- Correlate log events with system performance spikes.
- Troubleshoot issues by reviewing log data alongside metrics.
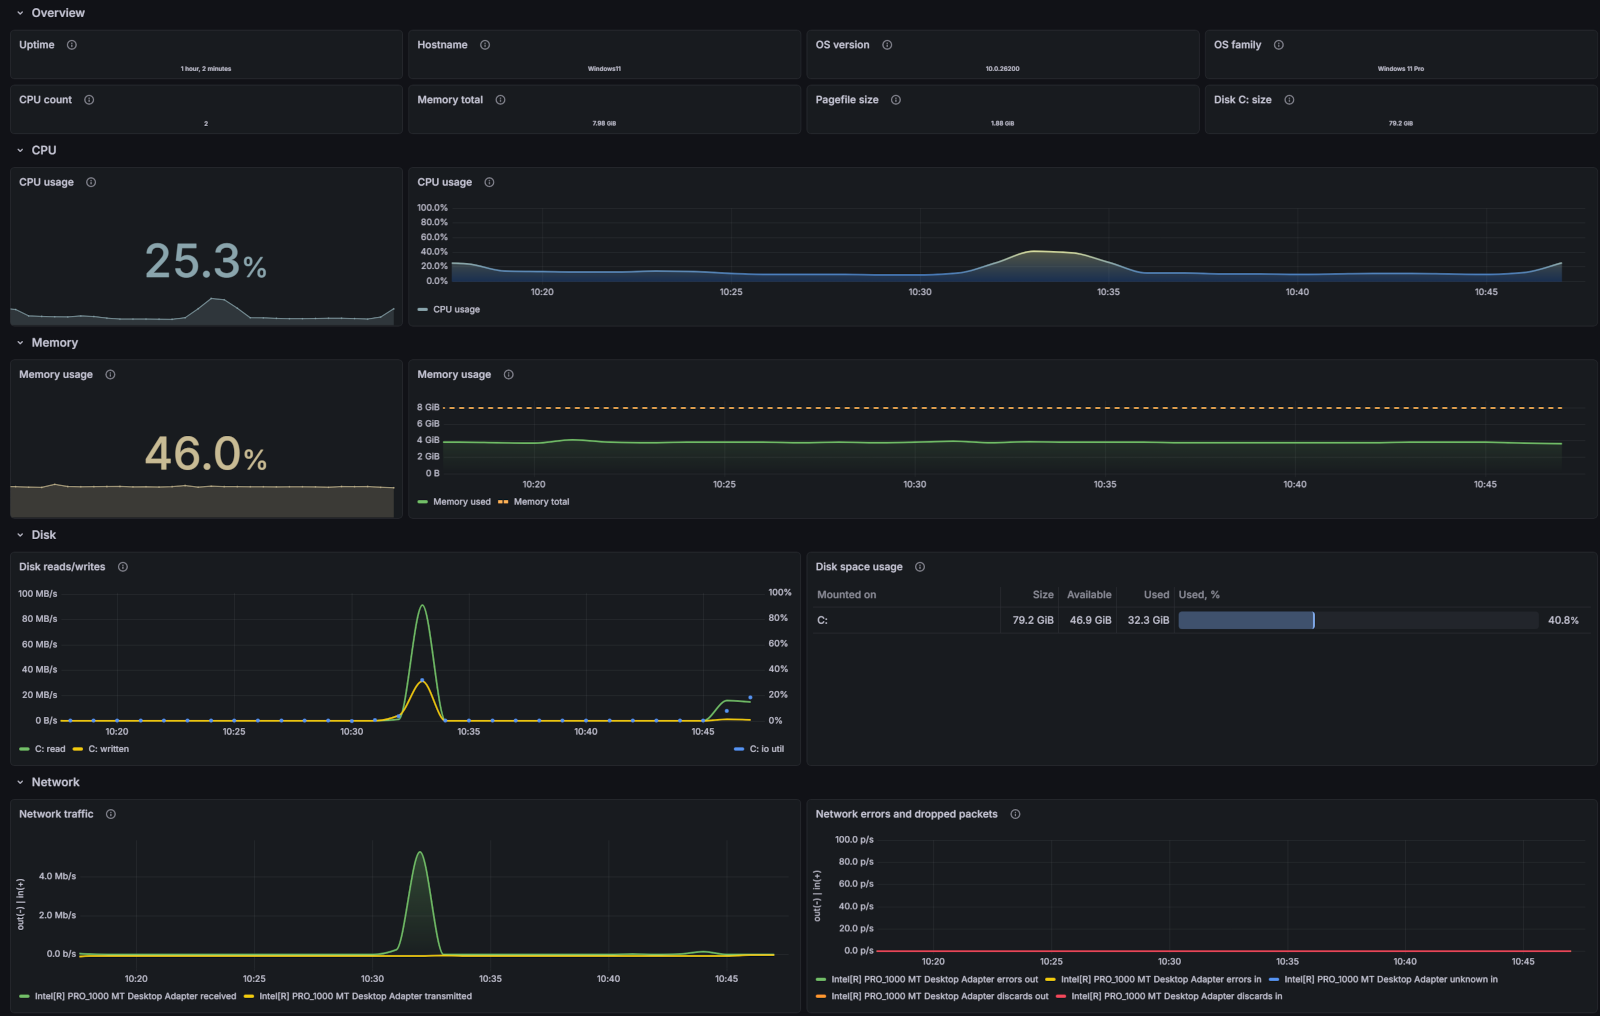
This dashboard provides a high-level view of your Windows system’s health and performance.
Use this dashboard to:
- View system uptime and availability.
- Monitor overall CPU and memory utilization.
- Check disk space and network traffic trends.
- Quickly identify if your system is operating within normal parameters.
At this point in your journey, you can explore the following paths: