Analyze test results in Grafana Cloud
In this milestone, you analyze your k6 test results in Grafana Cloud dashboards. The Grafana Cloud k6 interface provides comprehensive visualizations of your test performance, including response times, throughput, error rates, and system resource usage.
Analyzing results in Grafana Cloud gives you access to interactive dashboards, historical test data, and advanced filtering options that help you identify performance bottlenecks and understand how your system behaves under load.
To analyze test results in Grafana Cloud, complete the following steps:
Open the test results URL that was displayed in your terminal after running the test. If you don’t have it, in Grafana Cloud go to Testing & synthetics > Performance, select the appropriate project and test, then select the most recent test run from the list.
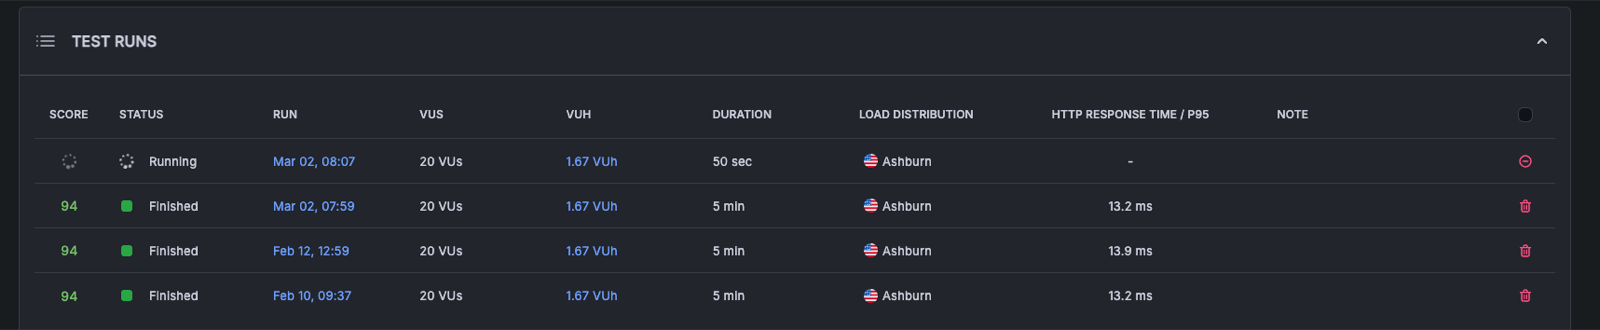
You should see your test run listed with a status of
Finished(if the test completed) orRunning(if it’s still in progress).![Test runs list showing finished k6 test runs with score, status, and response time]()
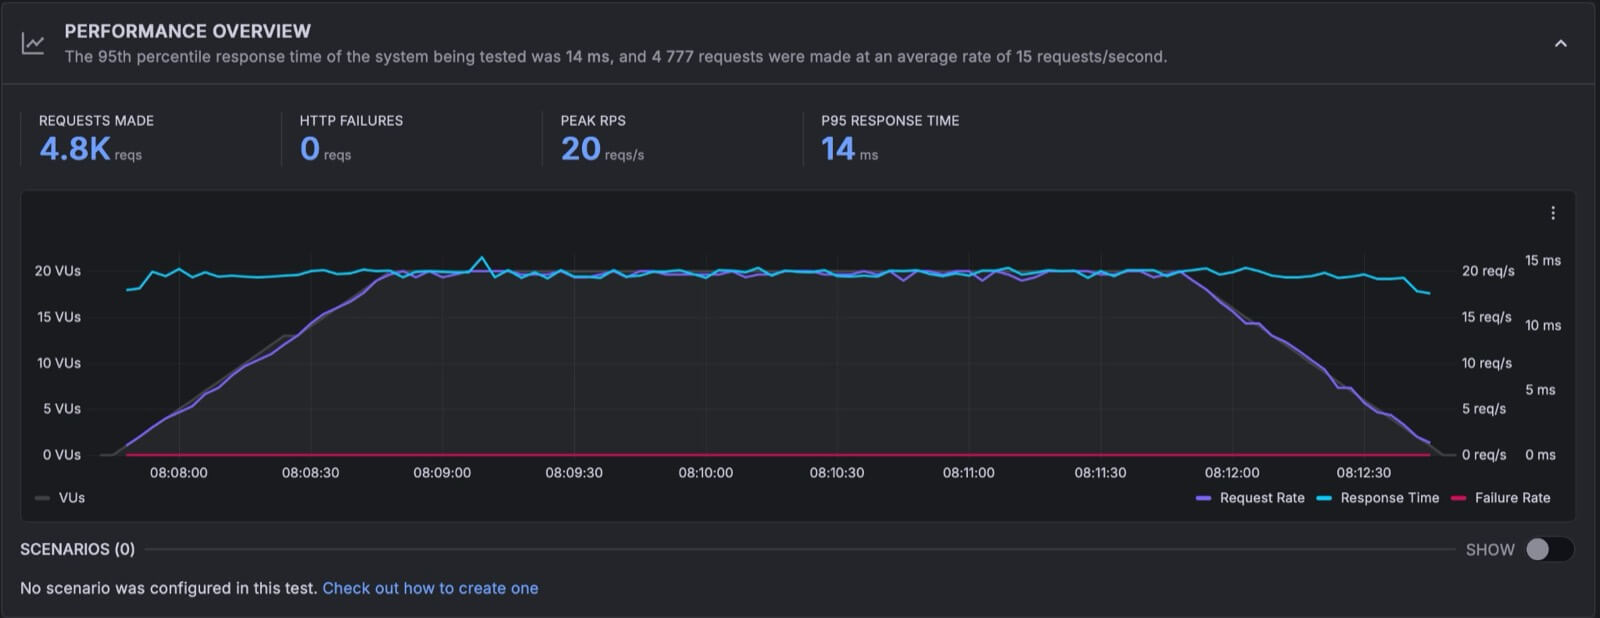
Review the performance overview dashboard, which displays:
- Test summary information (duration, virtual users, iterations)
- HTTP request statistics (total requests, success rate, error rate)
- Response time metrics (average, median, p95)
- Throughput metrics (requests per second, data transfer rates)
- Test timeline showing performance over time
![Performance Overview panel showing requests made, HTTP failures, peak RPS, P95 response time, and a timeline chart]()
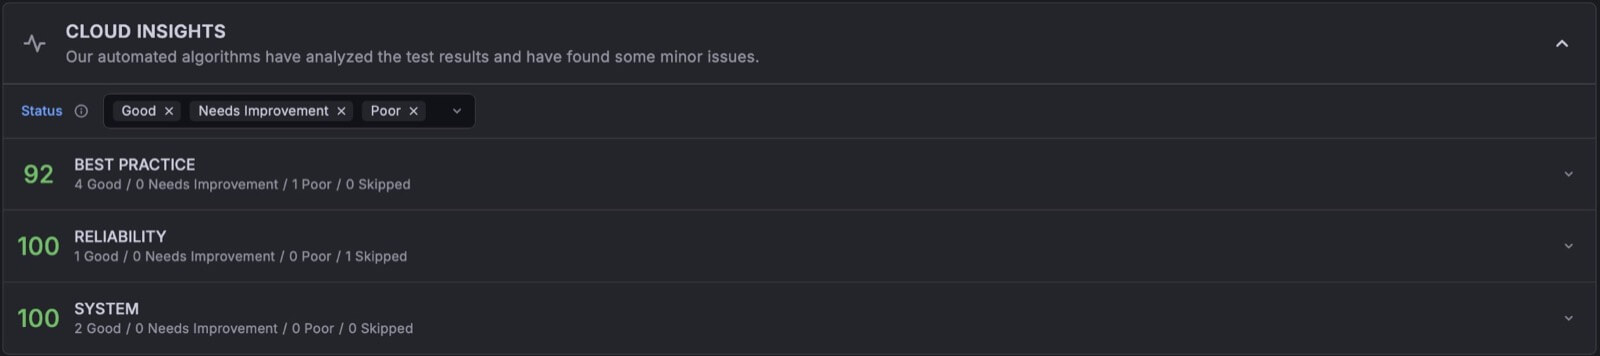
Scroll down to the Cloud Insights section. Cloud Insights uses automated algorithms to analyze your test script and results, then generates scores and recommendations across categories such as best practice, reliability, and system performance. Review any issues flagged to identify areas for improvement.
![Cloud Insights section showing scores for best practice, reliability, and system categories]()
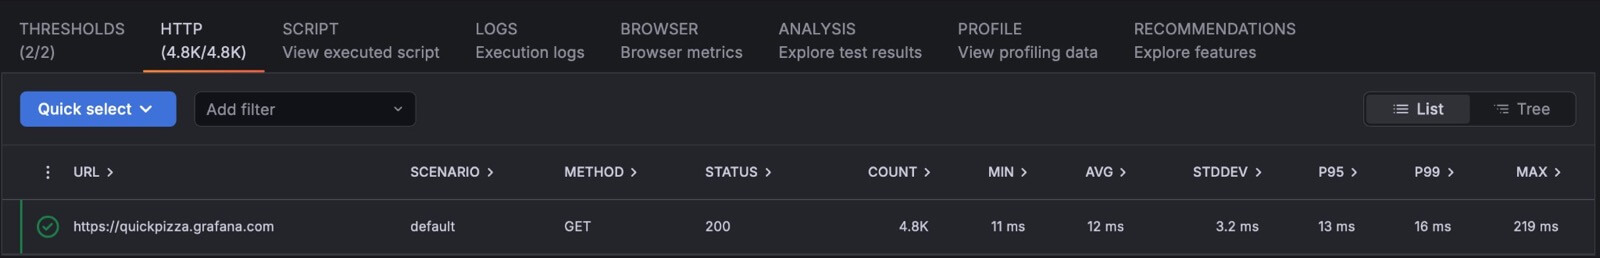
Select the HTTP tab to explore detailed request metrics for each endpoint in your test:
- Count: Total number of requests made to each endpoint
- Response times: Min, average, standard deviation, P95, P99, and max response times
- Status: The HTTP response status code returned by each endpoint
![HTTP tab showing request URL, method, status, count, and response time percentiles]()
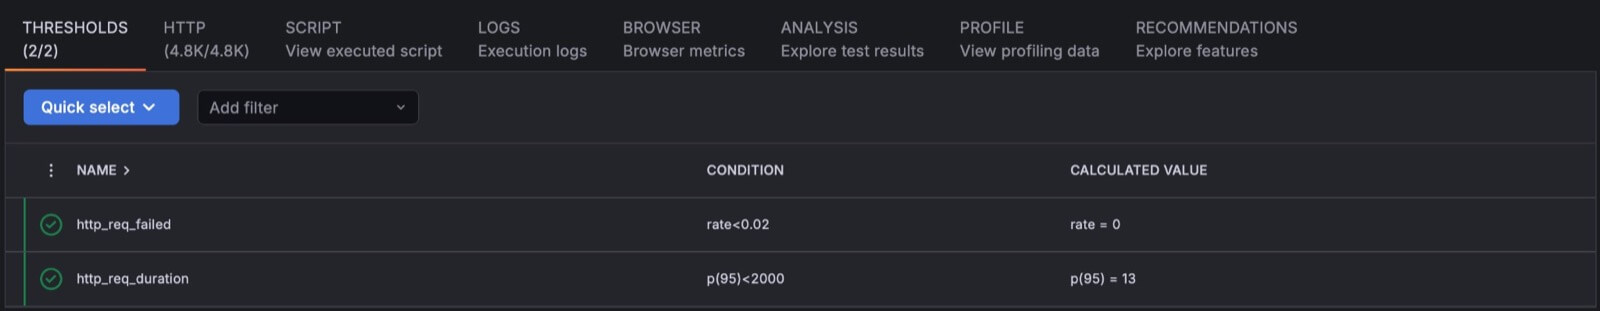
Select the Thresholds tab to review the thresholds for your test. Grafana Cloud k6 automatically applies default thresholds such as
http_req_failedandhttp_req_durationto help you evaluate test performance. You can also define custom thresholds and checks in your test script to set specific pass/fail criteria for future tests.![Thresholds tab showing default thresholds for HTTP request failure rate and duration]()
After completing these steps, you should see comprehensive test results displayed in interactive dashboards, showing performance metrics, request statistics, and timeline visualizations that help you understand how your application performed under load. The dashboard should show metrics such as response times, request rates, and any errors that occurred during the test.
In the next milestone, you’ll celebrate completing your first k6 performance test and learn about next steps for continued learning.
Please tell us what didn't work: