
Verify traces in Grafana Cloud
Send sample traces
You can use your instrumented application to send traces or can use the telemetrygen tool to send traces.
Use your instrumented application to send traces
Once Alloy is running, you can use your instrumented application to send traces. Start your application or service and then check Grafana Cloud to verify that traces are being received.
Use telemetrygen to send traces
You can use OpenTelemetry telemetrygen to generate tracing data.
Install
telemetrygenusing the installation procedure. NOTE: You don’t need to configure an OpenTelemetry Collector because we’re using Grafana Alloy.Generate traces using
telemetrygen:telemetrygen traces --otlp-insecure --rate 5 --duration 5s --otlp-endpoint 0.0.0.0:4317This configuration sends traces to Alloy for 5 seconds, at a rate of 5 traces per second.
If you receive a partialSuccess message, this indicates that the data has been received.
View traces in Grafana Cloud
To verify traces are being received using the TraceQL Query Editor, complete the following steps:
Sign in to your Grafana Cloud environment, for example
mystack.grafana.net.On the Grafana Cloud home page, open the navigation menu on the left side of the screen and click Explore.
From the data source drop-down at the top of the page, select your traces data source.
For example, select grafanacloud-traces.
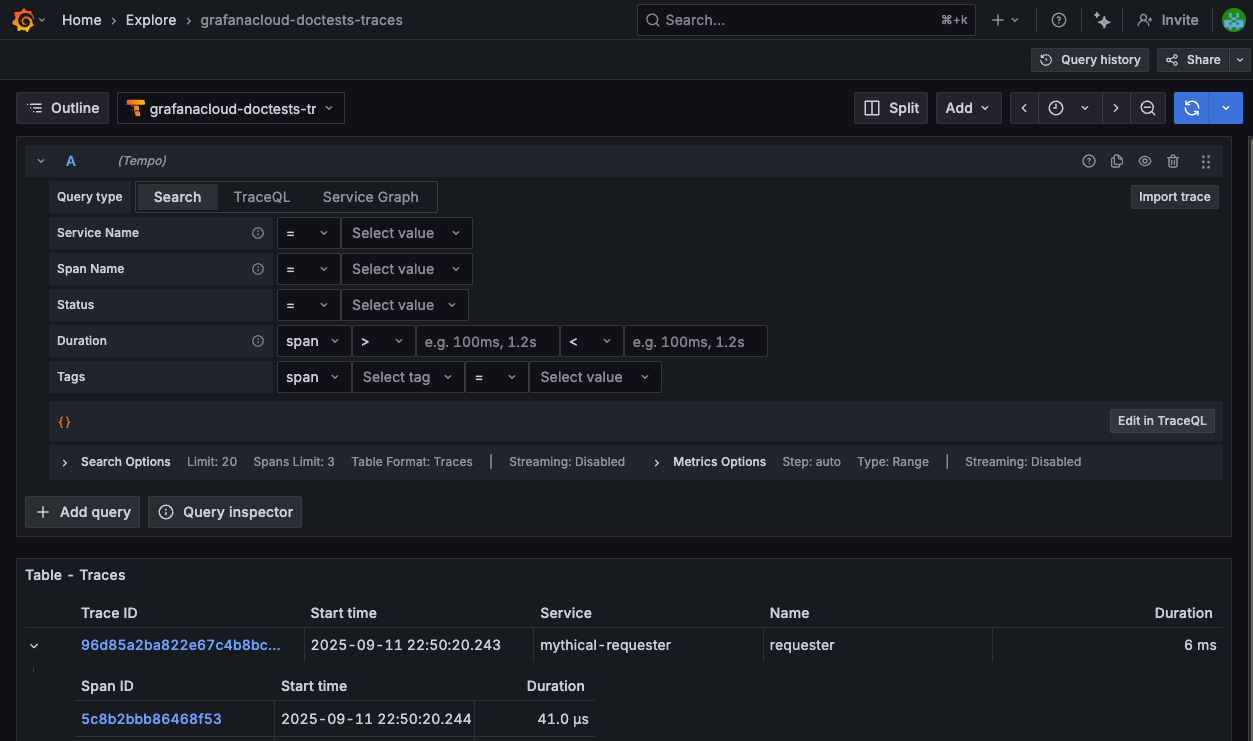
In the TraceQL query editor, select the Search tab and click Run query.
The
{ }query searches for all traces without any filters, making it the simplest way to verify Grafana Cloud received the trace data.![TraceQL Query Editor showing the Search tab with the query set to {} and the Run query button.]()
Verify traces appear in the results. If your configuration works correctly, the query returns a list of all received traces.
In your final milestone, you reach the destination and explore next steps for expanding your observability capabilities.
Please tell us what didn't work:
At this point in your journey, you can explore the following paths: