
Configure Grafana Alloy to send traces
For trace collection, you typically need the following types of components:
- Receiver components: Accept trace data from applications and other sources
- Processor components: Transform, filter, or enhance trace data
- Exporter components: Send processed traces to destinations like Grafana Cloud
The most common component for receiving traces is otelcol.receiver.otlp, which accepts OpenTelemetry Protocol (OTLP) traces from instrumented applications.
To configure trace collection components, you need to edit the configuration file.
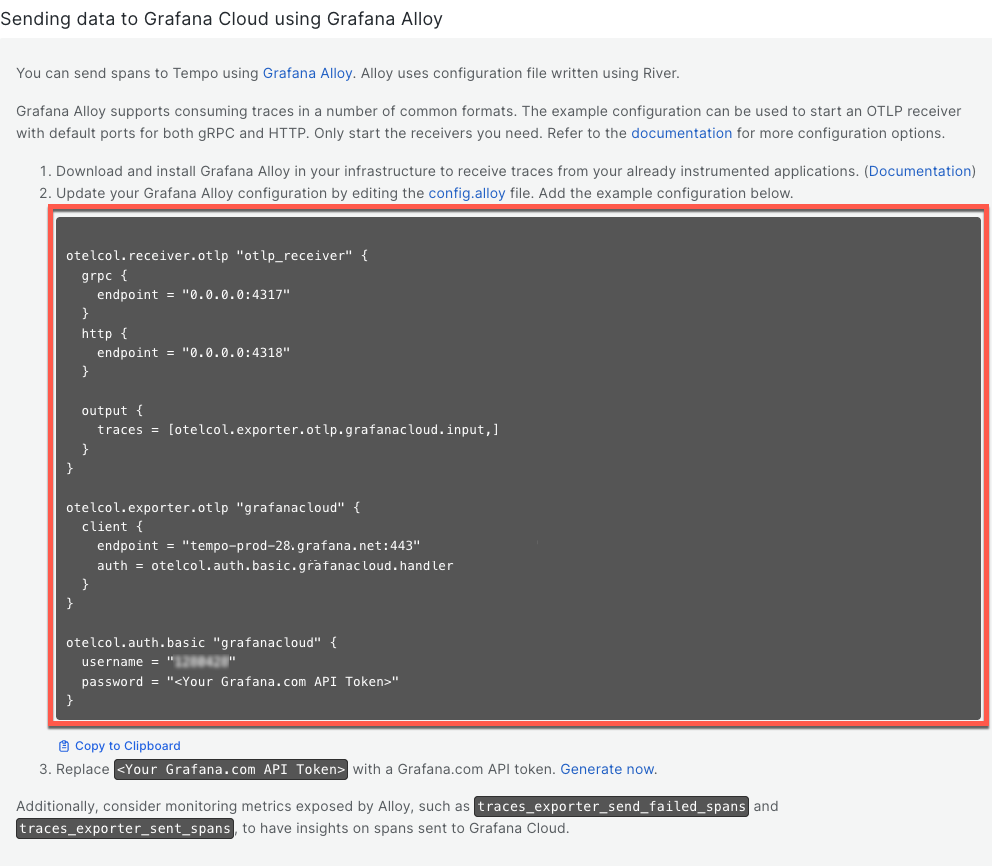
The example in this milestone includes the otelcol.receiver.otlp component that accepts traces on standard ports, and an OTLP exporter that sends traces to Grafana Cloud using basic authentication.
Alloy adds a default configuration file when you install it.
Create a configuration file and API token
To configure Alloy, complete the following steps:
Sign in to your Grafana Cloud stack and navigate to your stack.
Select Details next to your stack.
Locate the Tempo section and select Send Traces or Details.
Open the configuration file in your preferred text editor. The file location depends on your operating system. For example:
- Linux:
/etc/alloy/config.alloy - macOS:
$(brew --prefix)/etc/alloy/config.alloy - Windows:
%ProgramFiles%\GrafanaLabs\Alloy\config.alloy - Docker:
<CONFIG_FILE_PATH>
- Linux:
Copy the example configuration file from Sending data to Grafana Cloud using Grafana Alloy Step 2.
![example configuration file]()
Paste your configuration into your Alloy configuration file.
Return to your Grafana Cloud stack and create a new API token:
- Click Generate now on Step 3. Replace
<Your Grafana.com API Token>with a Grafana.com API token. - Enter a Token name.
- Select Create token. Copy the token.
- Click Generate now on Step 3. Replace
Replace
<Your Grafana.com API Token>with the token you just created.Save the changes to your configuration file.
Consider using batch processing if you’re using a production environment.
Next steps
In the next milestone, you will restart Alloy with your updated config.alloy and validate your configuration.
At this point in your journey, you can explore the following paths: