
Connect to a Prometheus data source in Grafana Cloud
Prometheus is an open source systems monitoring and alerting toolkit that captures metrics as time series data and optional key-value pairs called labels. Prometheus scrapes metrics from instrumented jobs, either directly or by way of an intermediary push gateway for short-lived jobs. It stores all scraped samples locally and runs rules over this data to either aggregate and record new time series from existing data, or generate alerts.
This journey teaches you how to configure a plugin that enables you to query, drill down, and visualize Prometheus metrics.
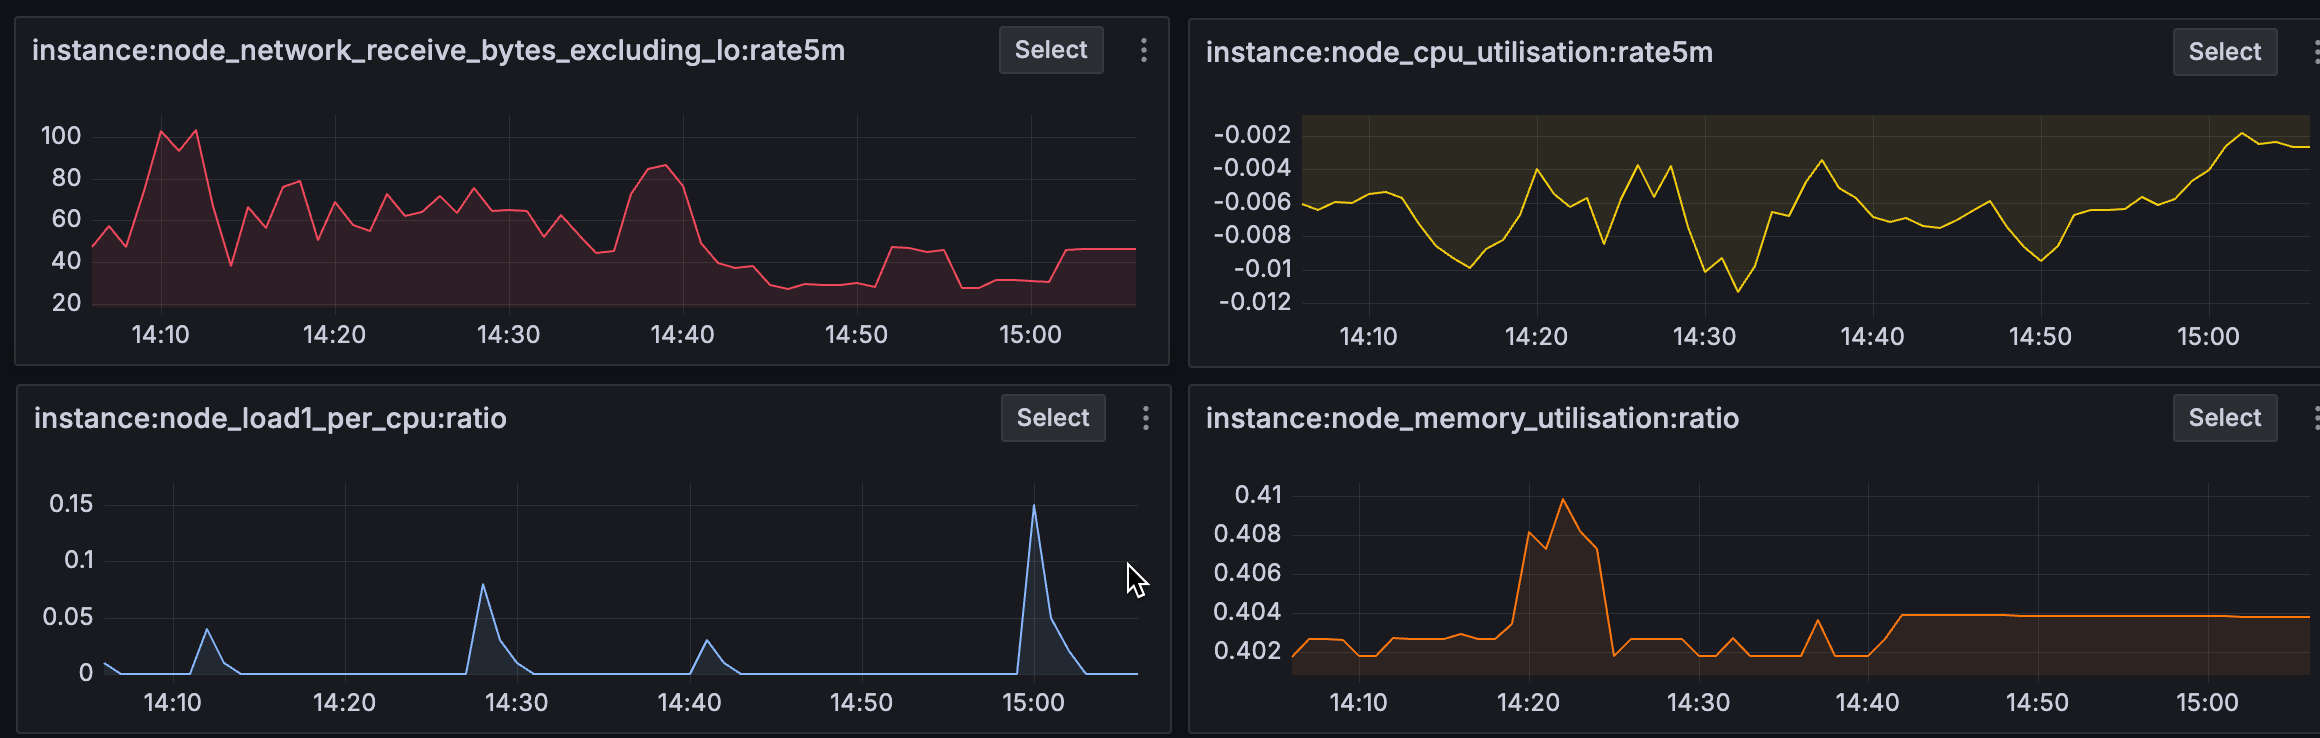
The following image shows the Grafana Drilldown Metrics app populated with Prometheus metrics.
Here’s what to expect
When you complete this journey, you’ll be able to:
- Describe the value of monitoring a Prometheus endpoint
- Verify that your self-managed Prometheus server is capturing metrics
- Enter the URL and credentials of your Prometheus server
- Select a private data source connection and test the connection
- Verify that metrics appear in Grafana Drilldown Metrics
Troubleshooting
If you get stuck, we’ve got your back! Where appropriate, troubleshooting information is just a click away.
More to explore
We understand you might want to explore other capabilities not strictly on this path. We’ll provide you opportunities where it makes sense.
Before you begin
Before you connect to a Prometheus data source, ensure you have:
- A Grafana Cloud account. To create an account, see Grafana Cloud.
- Experience working with Prometheus and understand its basic set up and operation.
- Downloaded, installed, and configured Prometheus to collect metrics.
- Access to the machine on which Prometheus is installed.
- Knowledge of the authentication method applied to the Prometheus database and credentials of the Prometheus database.
- Created a private connection to a data source and the PDC agent is running.
- While not required, setting up a private data source connection is highly recommended.