
Navigate from dashboard visualization to create alert rule
In this milestone, you learn how to navigate from a dashboard visualization to create an alert rule. Starting from a dashboard panel makes alert creation easier because the query is already defined and tested.
This approach ensures consistency between what you visualize and what you alert on.
To navigate from a visualization to create an alert, complete the following steps:
In Grafana Cloud, click Dashboards and open a visualization.
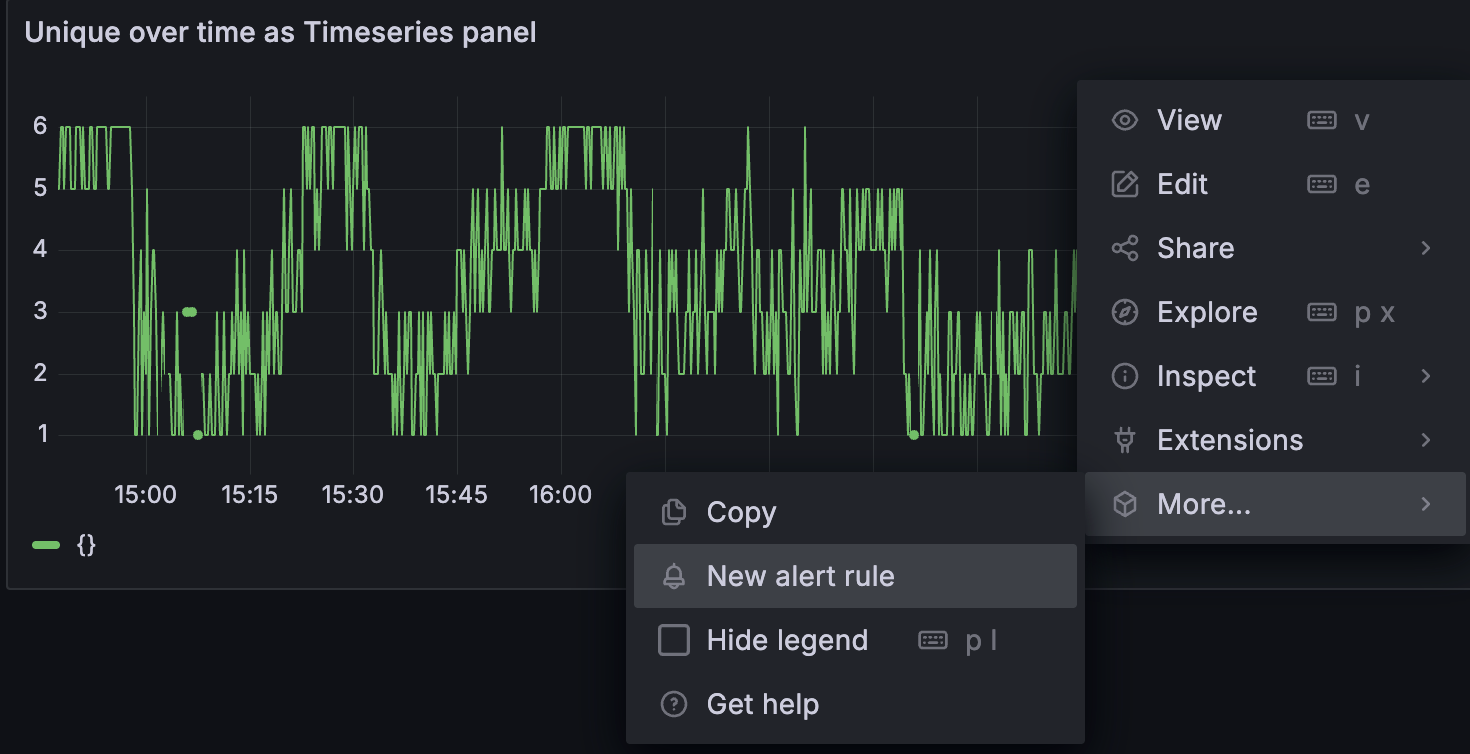
Hover over the top-right corner of a panel and click the panel menu icon.
From the drop-down menu, select More… > New alert rule.
The New Alert rule page opens.
The following image shows how to navigate from a logs visualization to the New Alert rule page.
In the next milestone, you’ll name the alert and define the alert rule conditions.