
Create infrastructure alerts in Grafana Cloud
Welcome to the Grafana learning journey that shows you how to create alert rules for your infrastructure. Grafana Alerting is a comprehensive alerting solution that enables you to monitor your infrastructure proactively—whether you’re alerting on metrics like CPU and memory usage, or logs that indicate errors and anomalies.
This journey takes a standalone approach: you don’t need existing dashboards or prior visualization experience. You’ll use Grafana’s exploration tools to find the data you want to alert on, then build an alert rule from scratch using the query builder.
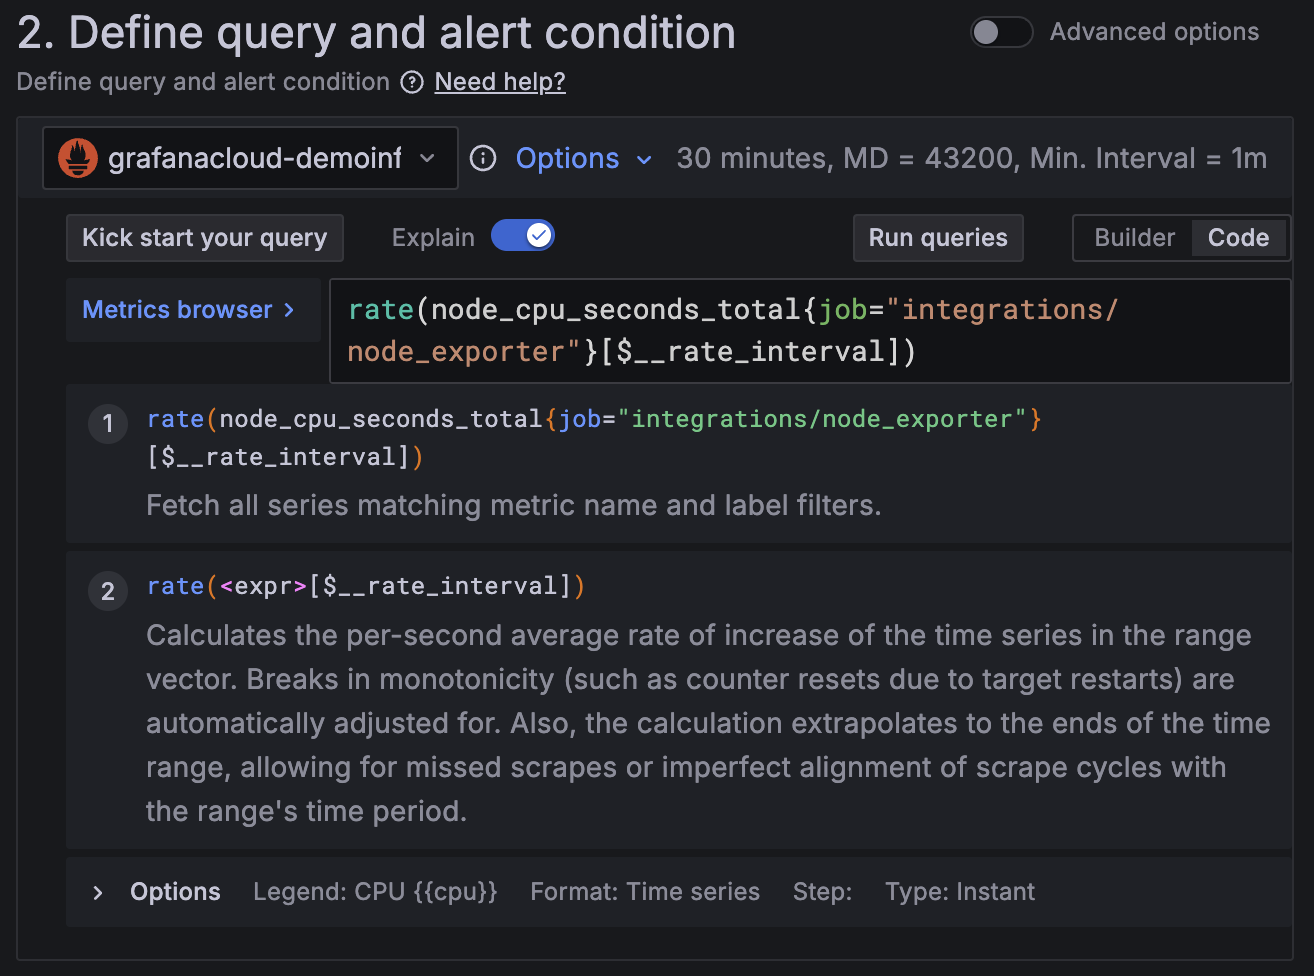
The image below shows a basic alert rule query with an explanation of the query function.
Here’s what to expect
When you complete this journey, you’ll be able to:
- Understand the value of Grafana Alerting and when to use it
- Find metrics or logs to alert on using Grafana’s exploration tools
- Navigate to create a new alert rule from the Alerting menu
- Build an alert query from scratch using the query builder
- Configure alert conditions and thresholds
- Set evaluation behavior and organize alerts with labels
- Configure notification settings and contact points
- Save, activate, and monitor your alert rules
Troubleshooting
If you get stuck, we’ve got your back! Where appropriate, troubleshooting information is just a click away.
More to explore
We understand you might want to explore other capabilities not strictly on this path. We’ll provide you opportunities where it makes sense.
Before you begin
Before you create infrastructure alerts, ensure that you have:
- A Grafana Cloud account. To create an account, refer to Grafana Cloud.
- Infrastructure data (metrics or logs) flowing into Grafana Cloud using agents such as Grafana Alloy, OpenTelemetry Collector, an integration, or other compatible methods.
- Editor or Admin permissions in your Grafana Cloud organization to create and manage alert rules.
- Basic familiarity with Grafana Cloud navigation.
- Understanding of what “normal” looks like for the metrics or logs you plan to monitor—this helps you set meaningful thresholds.
Note: This journey does NOT require existing dashboards or prior completion of visualization journeys. You’ll discover data and build alerts from scratch.