
Monitor an alert rule
After you save an alert rule, it’s active and monitoring your log data. The rule evaluates continuously according to your configuration and sends notifications when conditions are met.
You can use the Alerts rules page to monitor the health and performance of an alert rule.
Alerting insights provides a series of pre-built dashboards that allow you to monitor your alerting data. You can identify patterns in why things go wrong and discover trends in alerting performance within your organization.
To view and monitor an alert rule, complete the following steps:
Navigate to Alerting > Alert rules to view your alert rule in the rules list.
A list of alert rules appears on the Alert rules page.
If you have many alert rules, you can filter by data source and dashboard.
Use the tabs to explore the alert rules by State, Rule type, Health, and Contact point.
Monitor the alert rule status:
- Check that the State shows as Normal when conditions aren’t met.
- Verify the Health indicates Ok to confirm the rule evaluates successfully.
- Review the Last evaluation timestamp to ensure regular evaluation.
Test the alert rule (optional):
- If safe in your environment, temporarily trigger the alert condition.
- Monitor the alert state transition from Normal to Pending to Firing.
- Verify that notifications are sent according to your configuration.
To monitor alert rule performance:
Click Alerts & IRM > Alerting.
Scroll down to the Insights tab.
- Use the built-in alerting dashboards to track rule evaluation timing.
- Watch for any evaluation errors or performance issues.
- Adjust evaluation frequency if needed based on system performance.
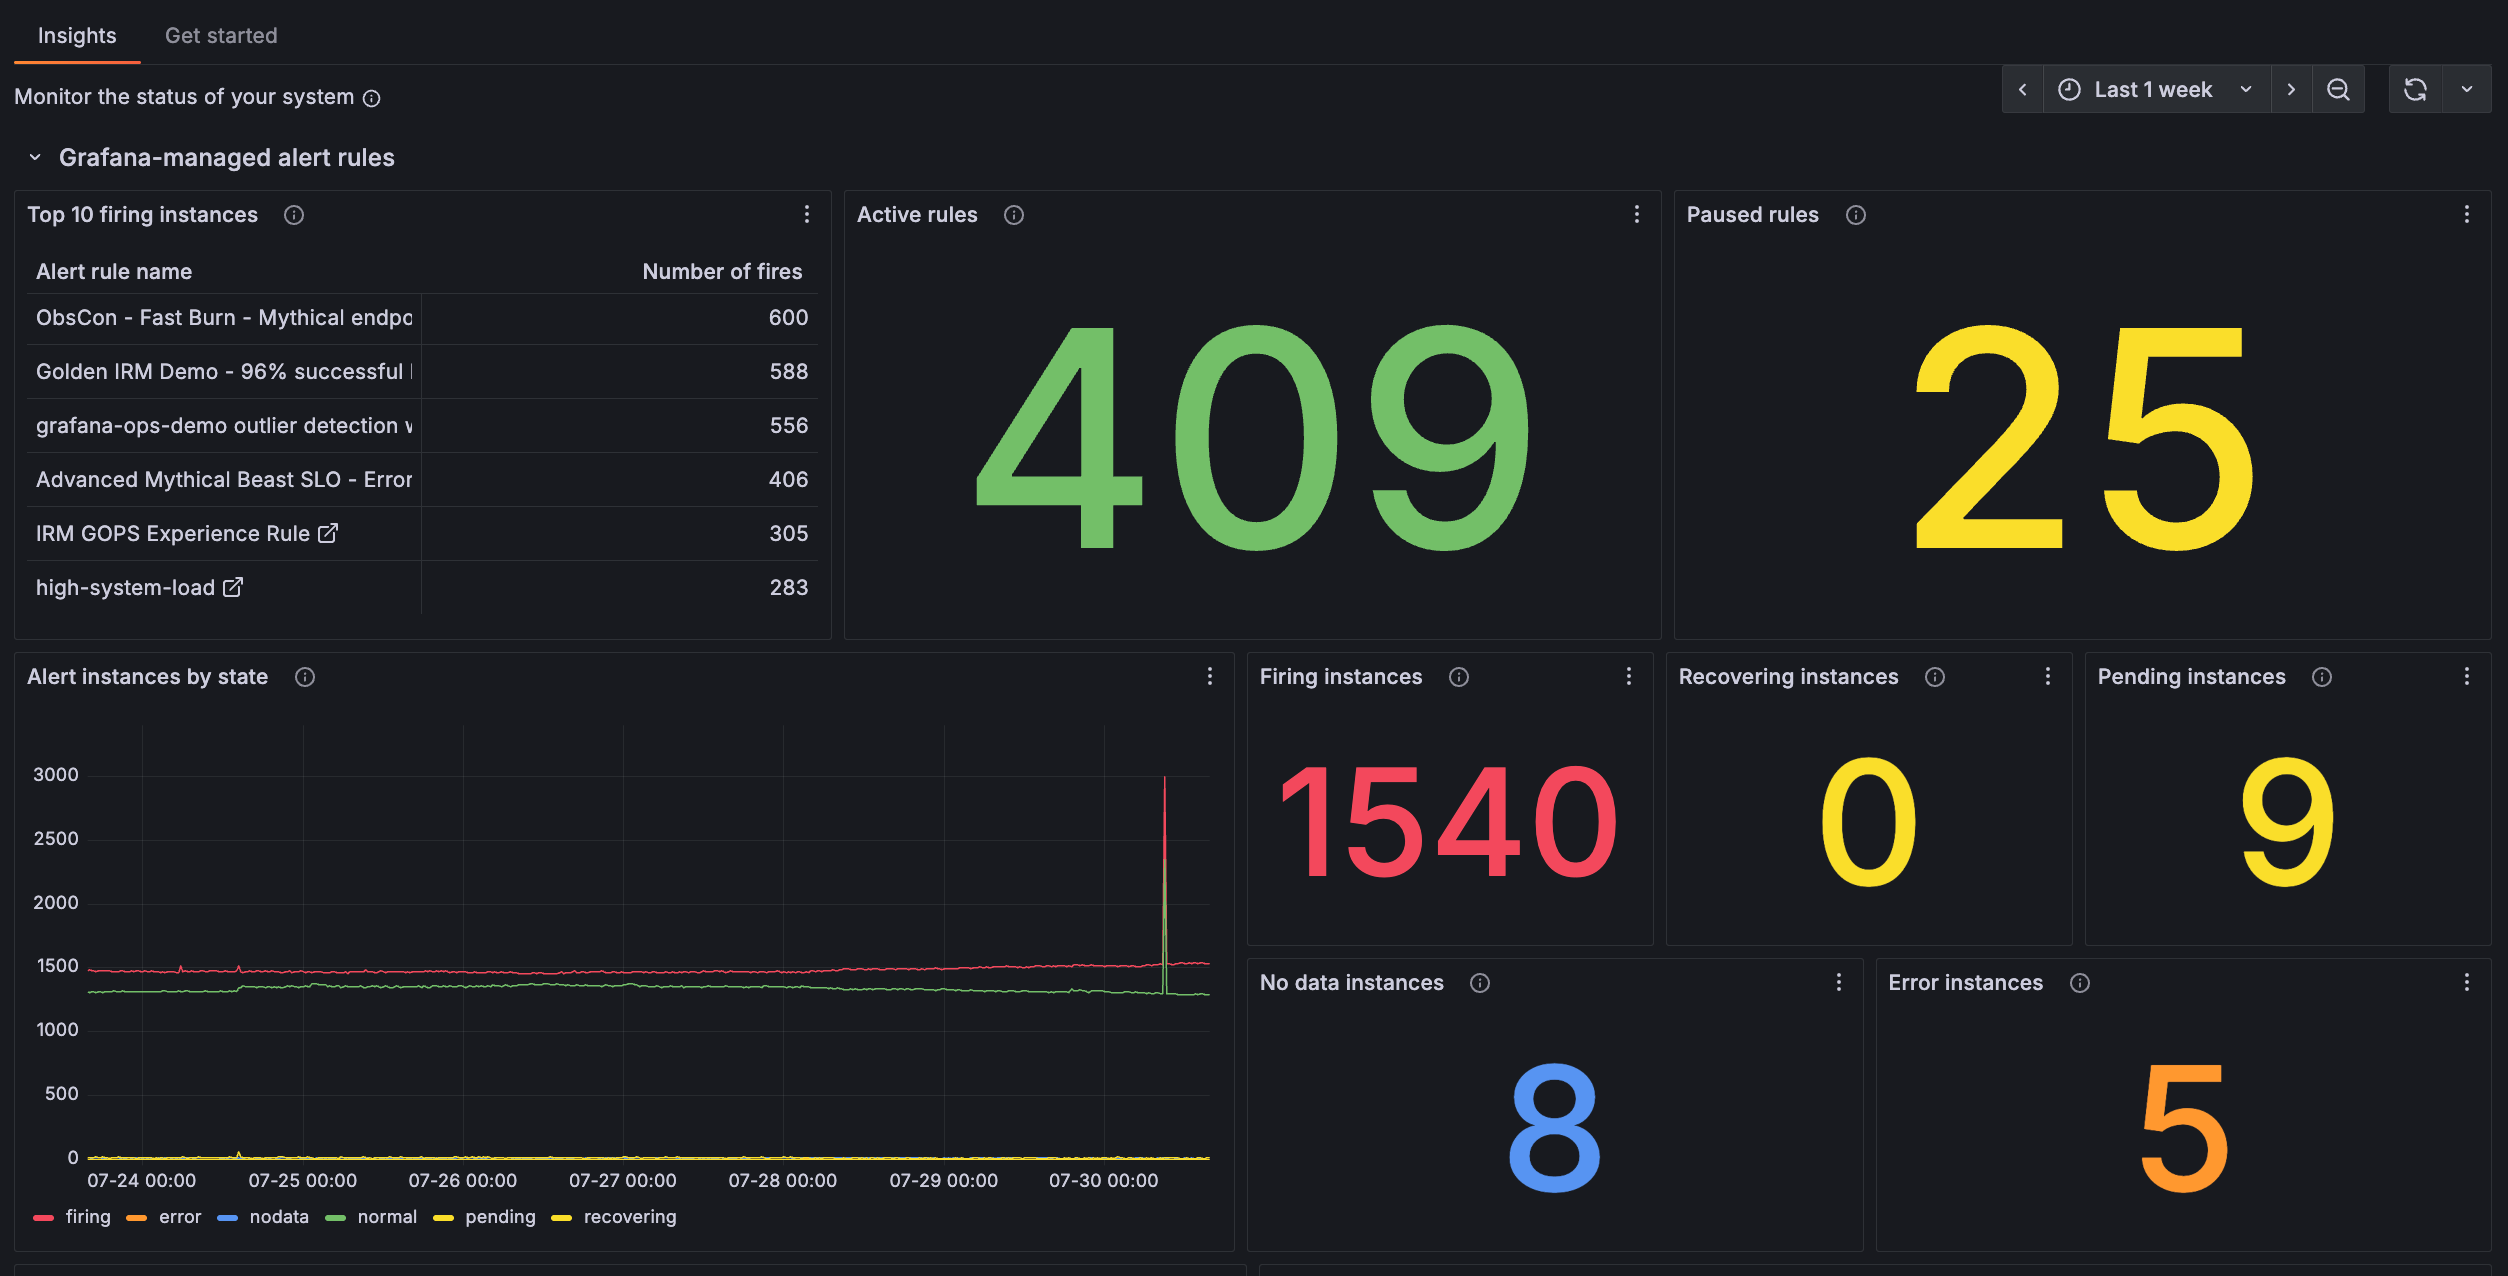
The following image shows a summary of alert rules and states.
![Image shows a summary of alert rules and states]()
At this point in your journey, you can explore the following paths: