
Create log alert rules with Grafana Alerting
Welcome to the Grafana learning journey that shows you how to create alert rules from your logs. Grafana Alerting provides a centralized alerting system that unifies alerting information in a single, searchable view. This allows you to create alert rules based on any data source, including logs stored in Grafana Loki, enabling proactive monitoring of your systems and applications.
With Grafana Alerting, you can receive notifications when log patterns indicate potential issues, error rates exceed thresholds, or specific log events occur in your applications.
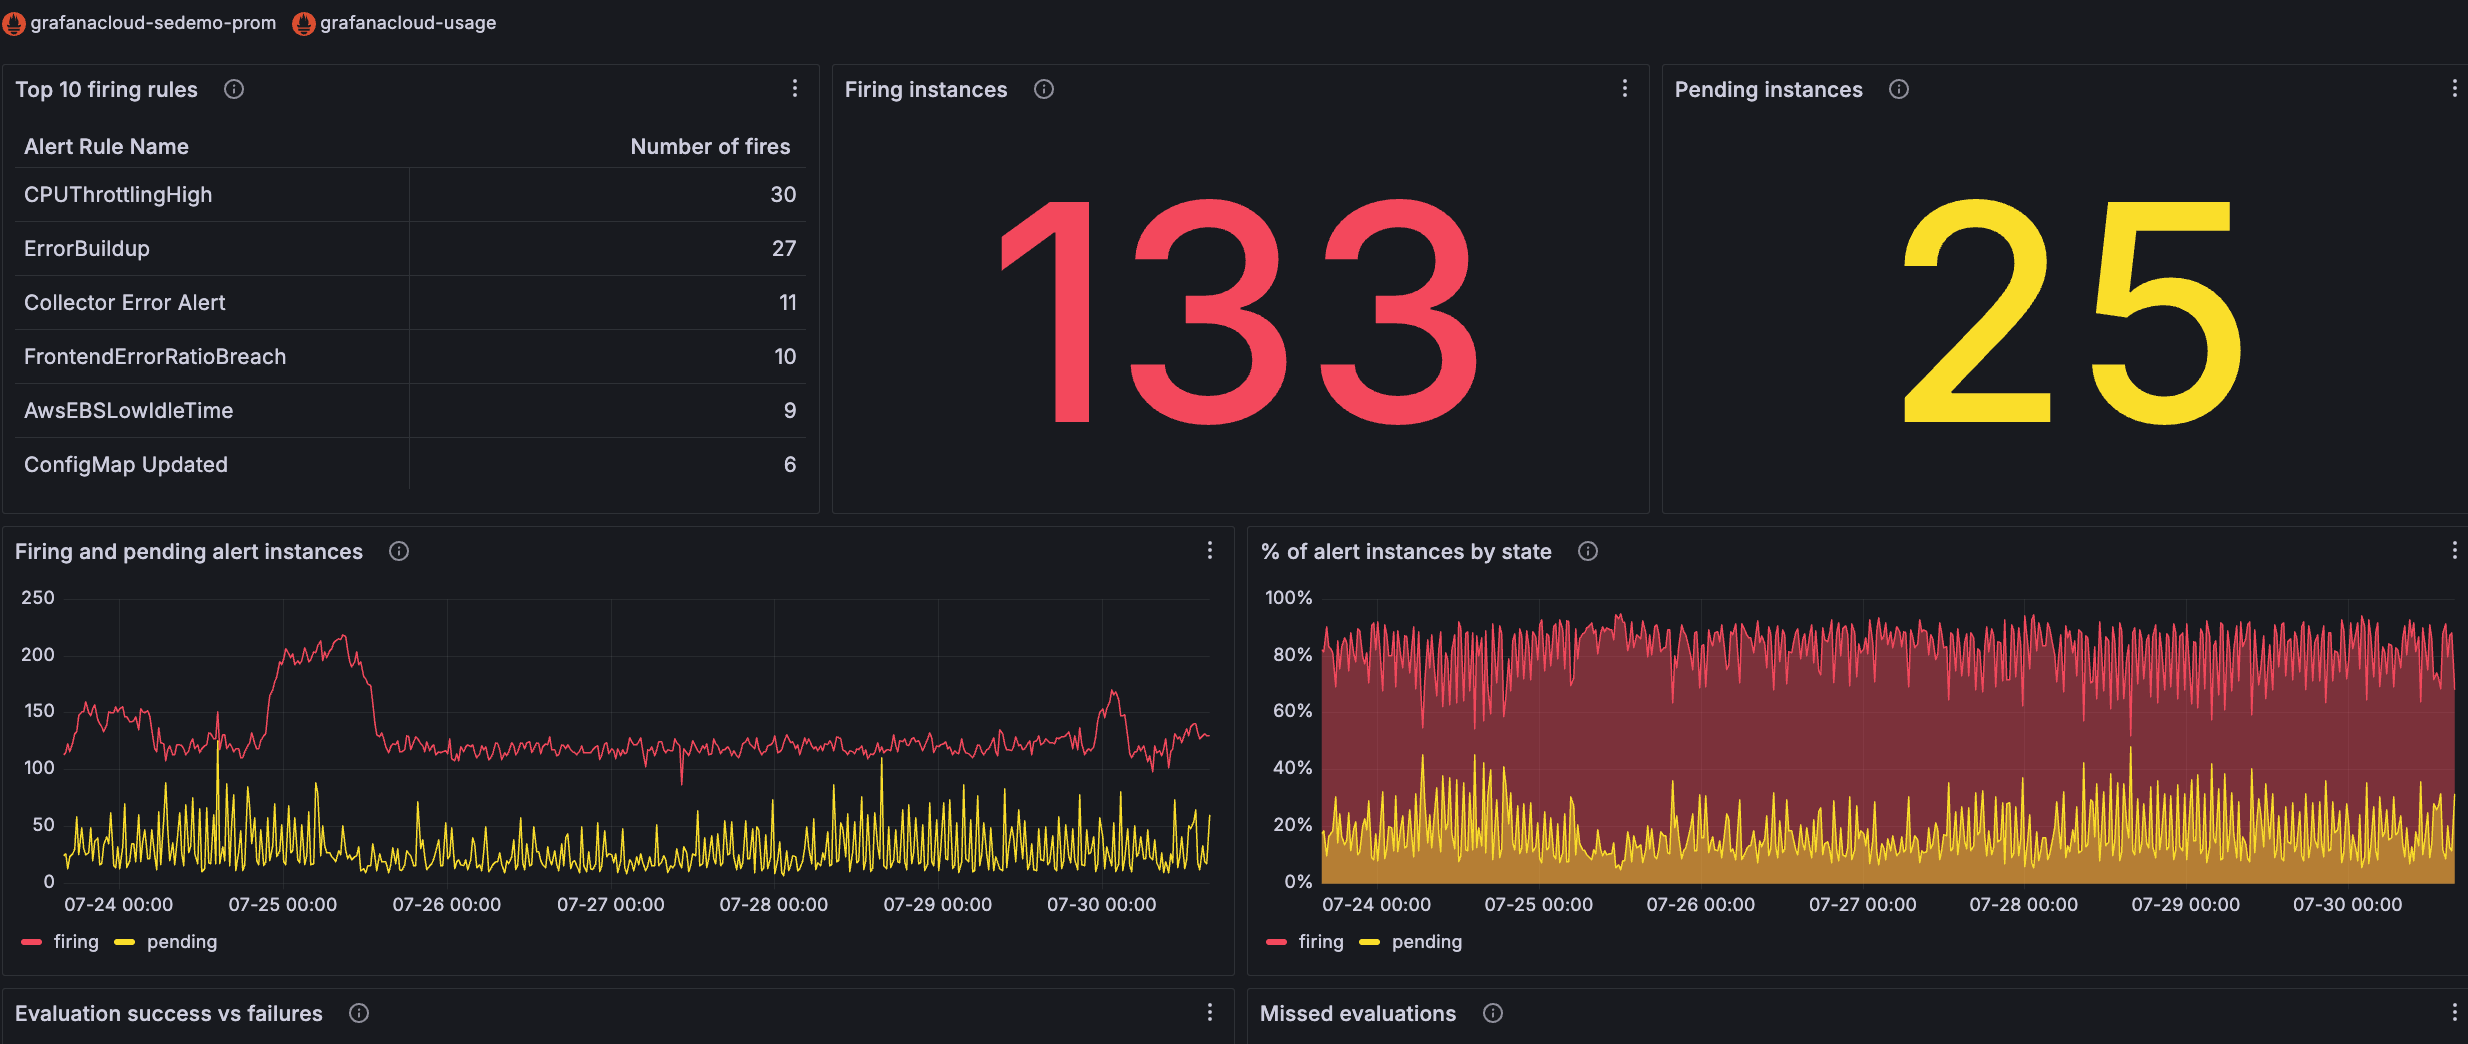
The alert dashboard image below shows the number of alerts firing and pending for each alert rule.
Here’s what to expect
When you complete this journey, you’ll be able to:
- Understand the value of Grafana Alerting for log-based monitoring
- Plan and design effective alert rules for log data
- Navigate from dashboard visualizations to create alert rules
- Configure alert rule queries and evaluation conditions
- Set up evaluation behavior and organize alerts with labels
- Configure notification settings and contact points
- Save and manage log-based alert rules
Troubleshooting
If you get stuck, troubleshooting information is available where appropriate.
More to explore
You might want to explore other capabilities not strictly on this path. Opportunities to explore further are provided where it makes sense.
Before you begin
Before you create log-based alert rules, ensure that you have:
- A Grafana Cloud account. To create an account, refer to Grafana Cloud.
- Basic familiarity with Grafana and Grafana Alerting concepts.
- Logs made available through a data source connection or ingested into Grafana Cloud Logs using agents such as Grafana Alloy, OpenTelemetry Collector, or other third-party clients.
- At least one dashboard with a log visualization that you want to alert on.
- A familiarity with the logs you plan to alert on. Understanding what these logs represent helps you create meaningful and actionable alert rules.
- Editor or Admin permissions in your Grafana instance to create and manage alert rules.