About Linux server integration pre-built dashboards
The Linux server integration provides a variety of pre-built dashboards that you can use right away to begin troubleshooting issues. In this step of the journey, you’ll become familiar with these pre-built dashboards and learn how to use them to address various problems.
While this journey only focuses on configuring the Linux server integration on one machine, the following dashboard images shows the kinds of data you’ll see when you monitor multiple machines.
Did you know? If you don’t see any logs or metrics, try switching the data source using the drop-down at the top of the dashboard.
Linux node/overview dashboard
This dashboard offers a comprehensive overview of the system, including:
- Metadata: Displays information such as the kernel version, OS release, uptime, and more.
- CPU utilization: Displays the current usage of the CPU.
- Memory utilization: Shows how much memory is being used.
- Disk utilization: Indicates the usage level of disk space.
- Network utilization: Provides information about network usage.
Use this dashboard to:
- Gain a high-level understanding of the operational status of your system.

Linux node/CPU and system dashboard
This dashboard shows information about the CPU and the system clock.
Use this dashboard to:
- Examine CPU utilization issues. It allows you to see overall CPU usage on the machine, but it won’t identify the specific process responsible for high usage.
- Monitor the system’s average load time across three time intervals: 1 minute, 5 minutes, and 15 minutes. This information reflects the demand on the CPUs.
- Confirm that the system clock is synchronized with an NTP server.

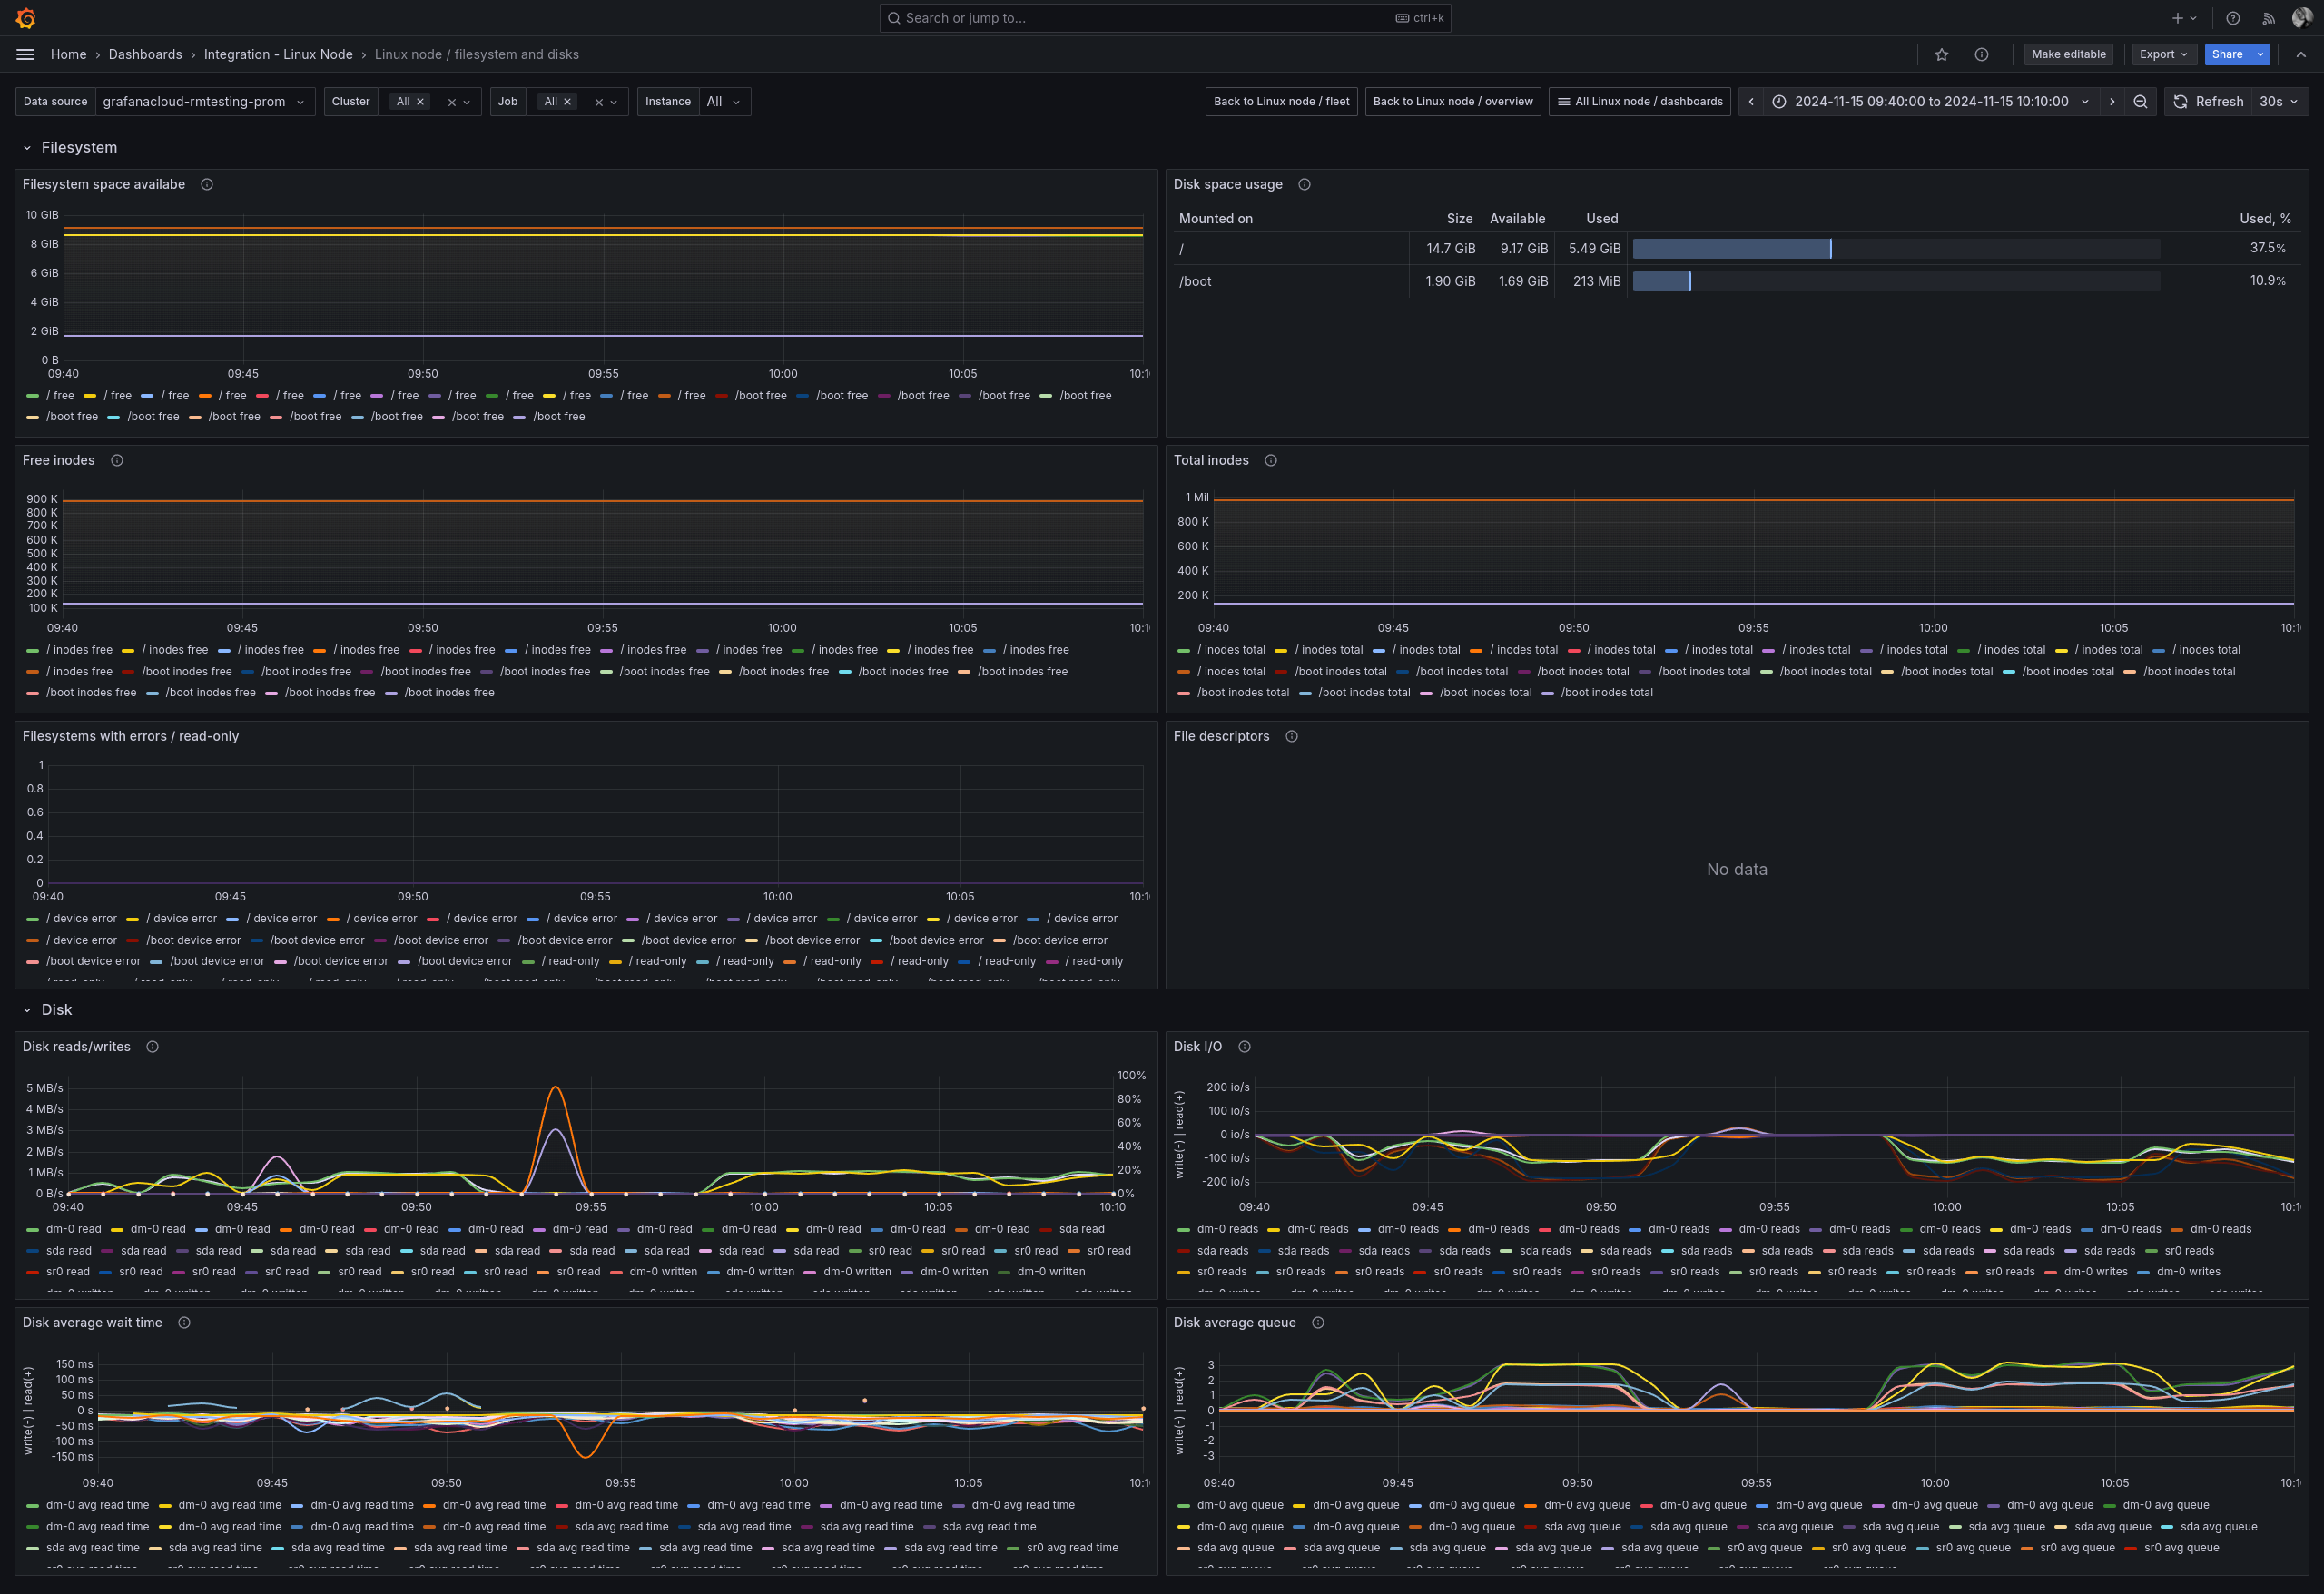
Linux node/filesystem and disks dashboard
This dashboard displays information about filesystems and disks, including available space per filesystem, overall disk space usage, read and write activity over time, and average wait times.
Use this dashboard to:
- Monitor disk capacity and determine when disks are nearing full utilization.
- Find filesystems that have errors.
- Detect when the input/output (I/O) load on the system is excessive, potentially leading to application latency.
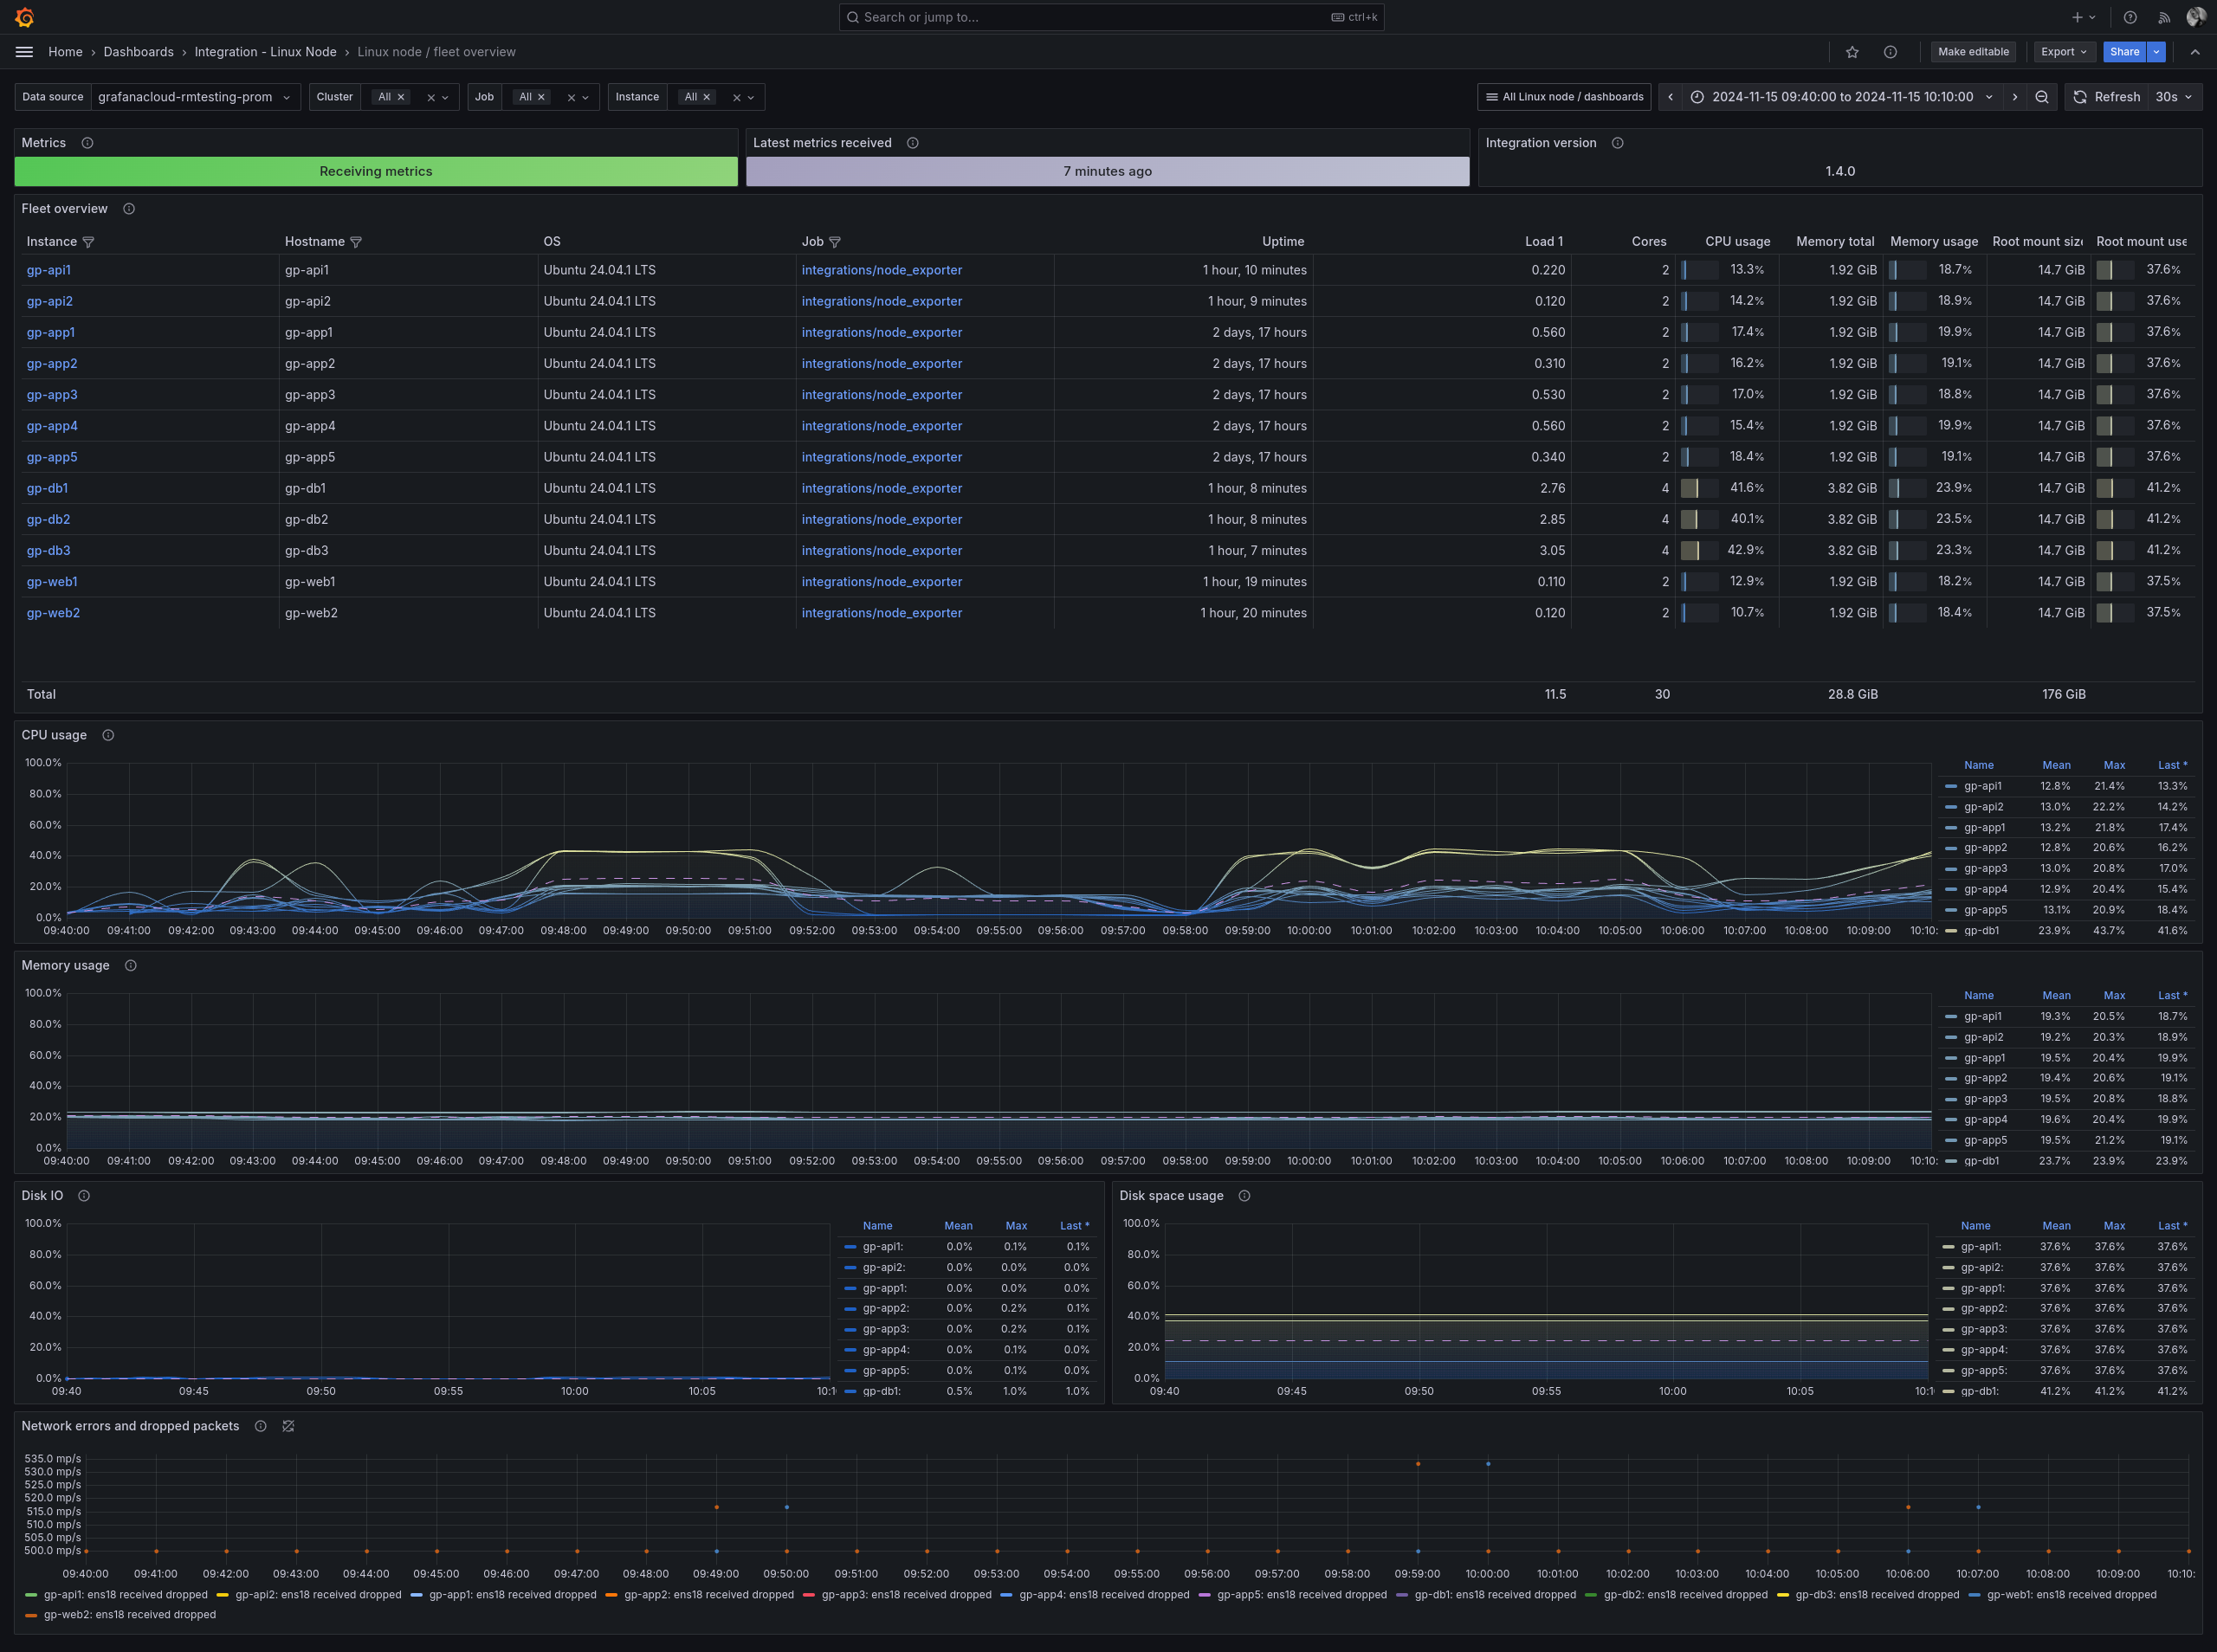
Linux node/fleet overview dashboard
This dashboard provides an overview of the entire fleet, which includes the following information:
- Metadata, such as the integration version and data retrieval status
- List of fleet members
- Performance metrics for the fleet, including CPU, memory, disk usage, and network activity
Use this dashboard to:
- Obtain a quick overview of the environment
- Identify outliers or unusual activities, and investigate specific nodes for further details
Linux node/logs dashboard
This dashboard provides an overview of logs gathered from the system, including the following:
- Metadata, such as the integration version and data retrieval status
- Performance metrics showing the volume of logs received
- An interactive view of the log entries themselves
Use this dashboard to:
- Check that logs are being received in a timely fashion
- Read and explore log entries

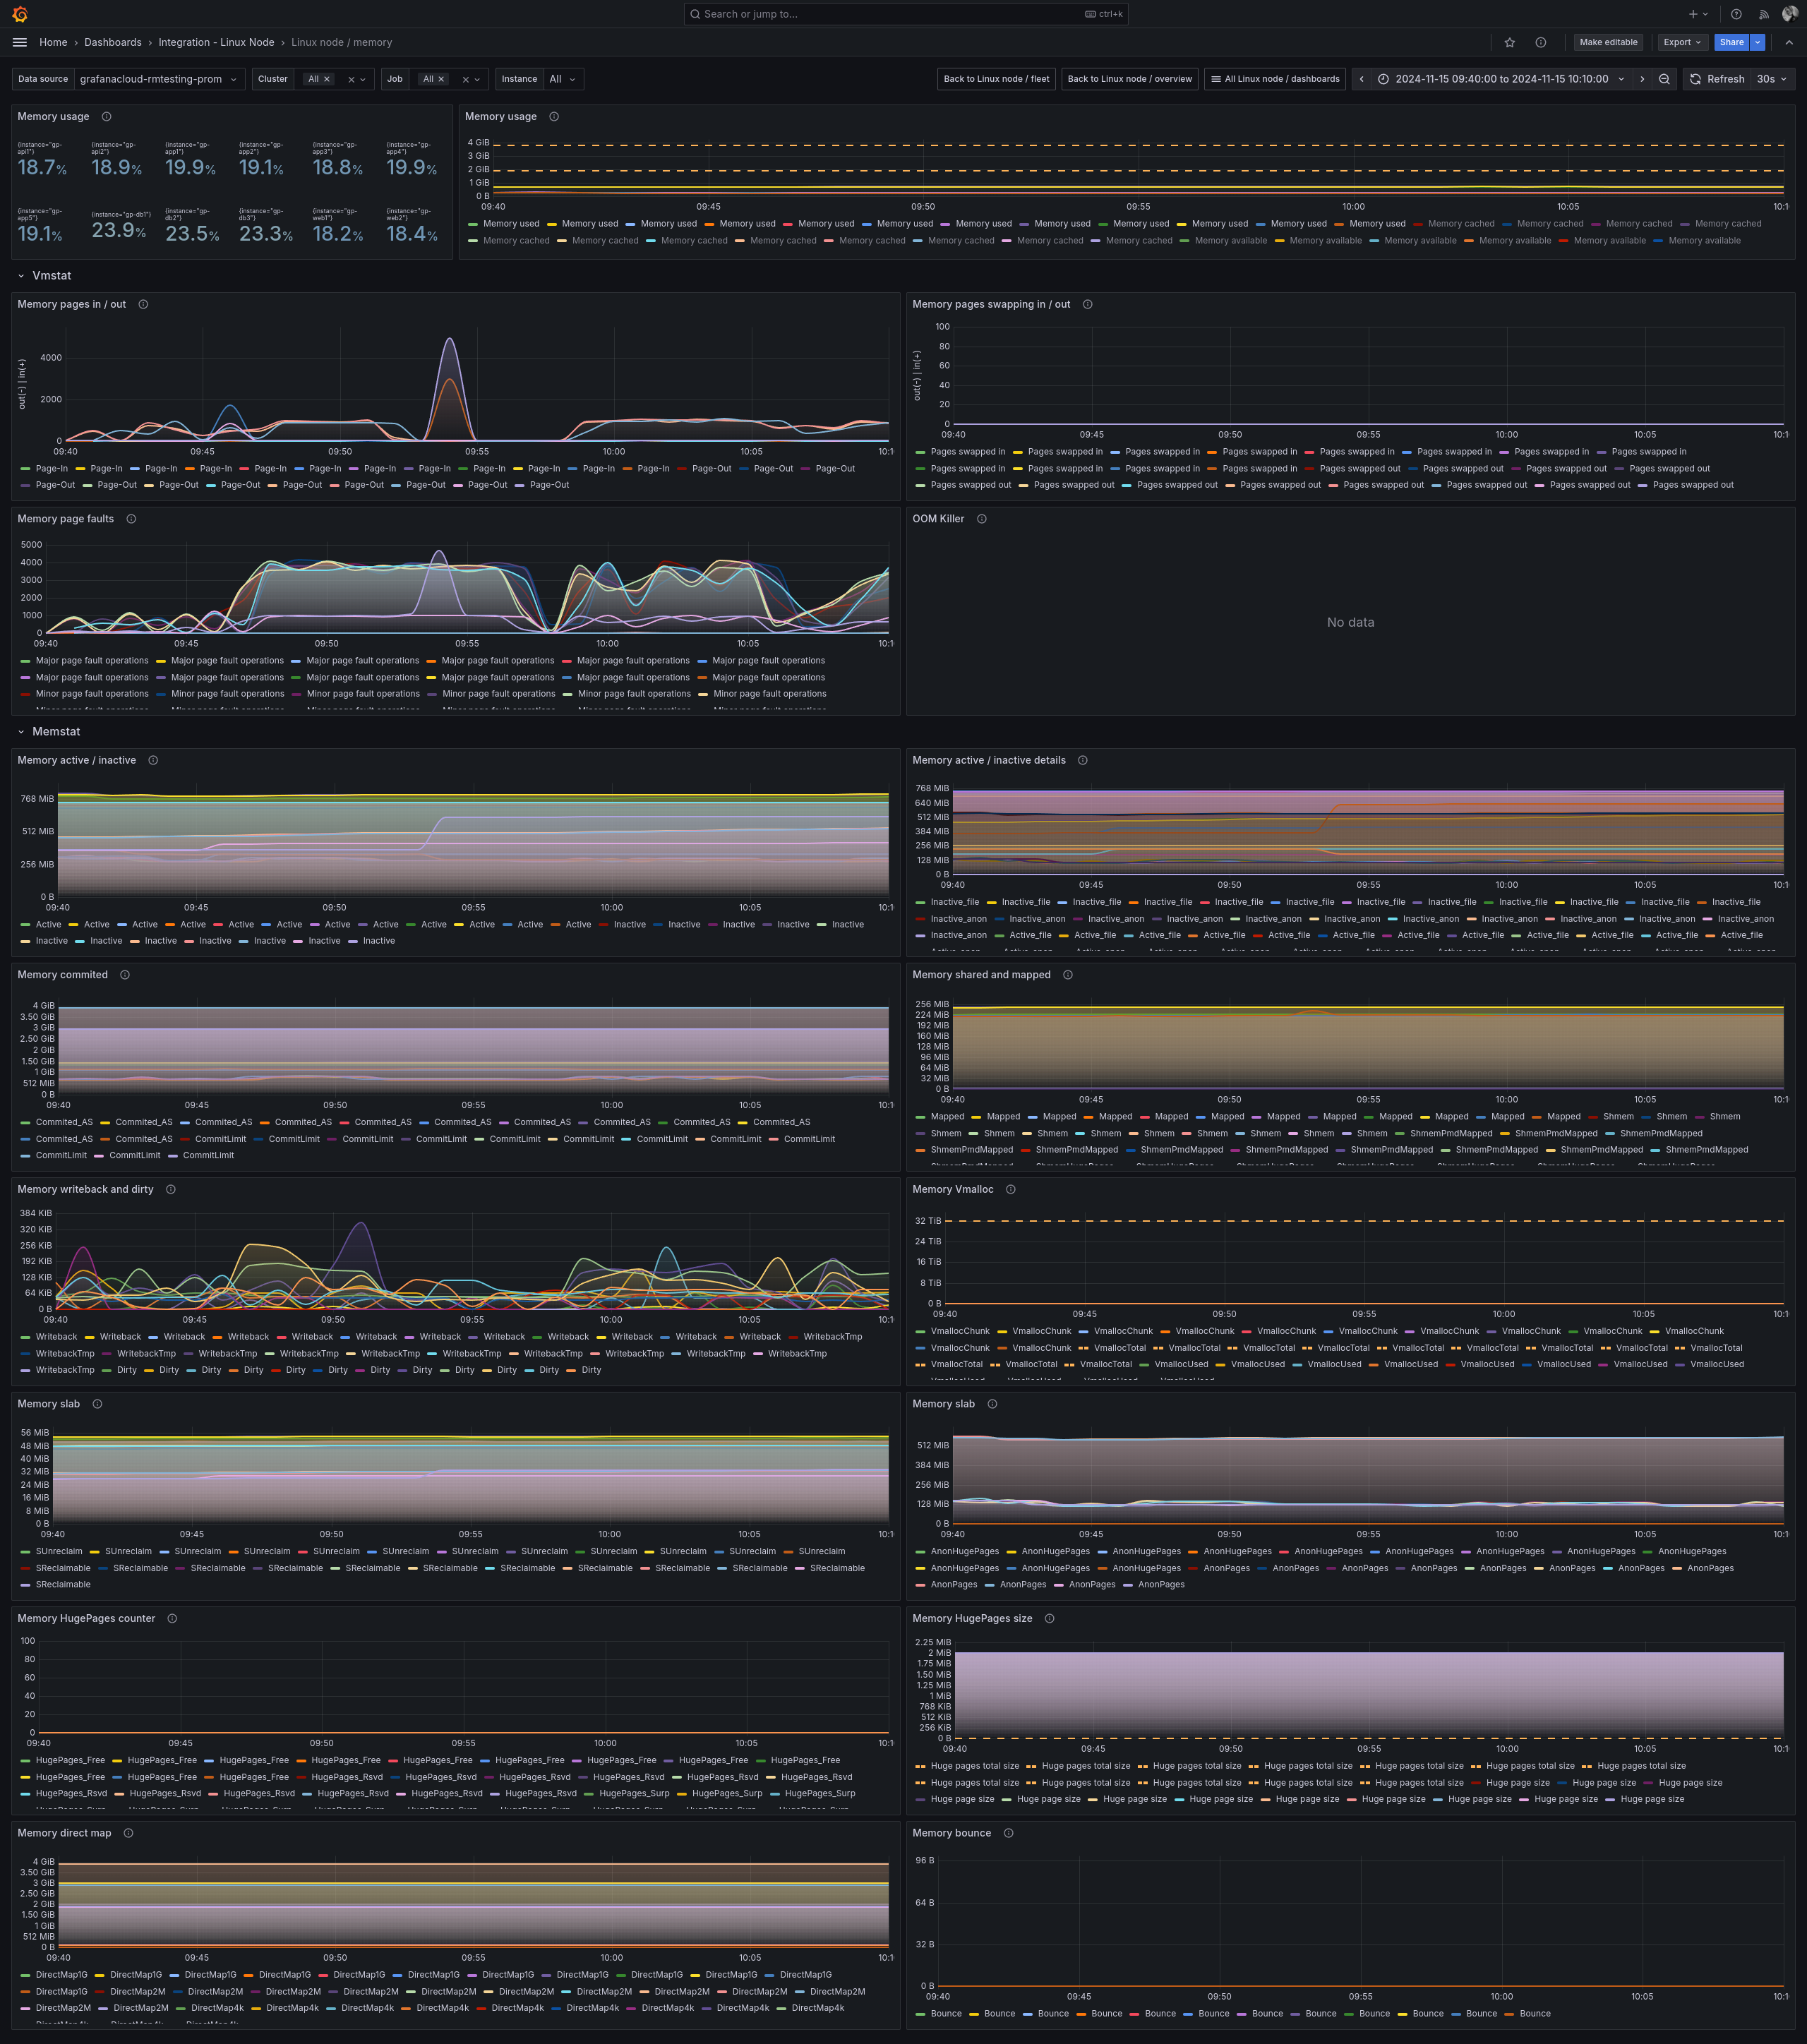
Linux node/memory dashboard
This dashboard provides details about used and available memory, including:
- Overview: Displays the percentage of total memory currently in use, both in real-time and over time.
- Virtual memory statistics: Pages in/out, page faults, and Out of Memory (OOM) Killer information.
- Memory statistics: Provides an overview of overall memory usage by processes, and how memory is allocated and freed.
Use this dashboard to:
- Track the memory usage of applications, including insights from the OOM Killer, which usually indicates a problem.
- Analyze paging information, which can reveal if the system is overwhelmed by applications demanding more memory than is physically available.
Linux node/network dashboard
This dashboard offers insights into the network, including:
- Network overview: Displays the status and usage of network devices connected to the system.
- Network sockets: Provides a summary of opened, closed, and in-use network connections.
- Network netstat: Presents an overview of packets being transmitted and received, including the error rate.
Use this dashboard to:
- Assess the functioning status of network devices.
- Detect transmission errors. A high TCP error rate suggests that there may be a malfunction somewhere in the network.

More to explore (optional)
Troubleshooting
Explore the following troubleshooting topic if you need help: